Portfolio analytics
A 60/40 Portfolio Is Not One Strategy
The label names a weight. It does not name a portfolio, and it does not name a return. This report sets out how far two books carrying the same headline allocation can differ, and how much of the difference survives even when the portfolio is held completely still.
Three Horizons Capital | 31 August 2026 | Fund allocations read from our own data 31 August 2026, at each fund's own portfolio date, spanning 31 March to 31 July 2026 | Capital market assumptions read 31 August 2026, 2026 vintage, ten-year horizon | US dollars | For professional and qualified investors | No fund, house, provider or issuer is named
14 to 66%
net equity across five live funds all sold as balanced, moderate or tactical, two of which carry the identical category tag
146bp
return spread across five portfolios held at exactly 60/40 by weight, with no leverage and nothing exotic
99bp
spread on one unchanged portfolio, depending only on whose capital market assumptions were used
Two portfolios arrive on the same page of the same board pack. Both report sixty per cent equities and forty per cent fixed income. The committee compares them on fee, on manager tenure, and on three-year performance, and moves on.
They are not the same portfolio. They may not even be the same kind of portfolio. One might hold domestic mega-caps against Treasuries. The other might hold global equities against private credit, emerging-market debt, inflation-linked bonds and a duration overlay. The headline is identical. Almost nothing underneath it is.
The governing thought
The label hides the portfolio, and the model hides the label. A 60/40 allocation is not a decision you have made. It is a decision you have deferred, twice.
Five funds sold as balanced hold between 14% and 66% in equities
Start with what is actually on sale. These are five live funds, all currently marketed under balanced, moderate or tactical allocation labels, and between them they hold $545bn. Each is shown at its own portfolio date, because they do not share one.
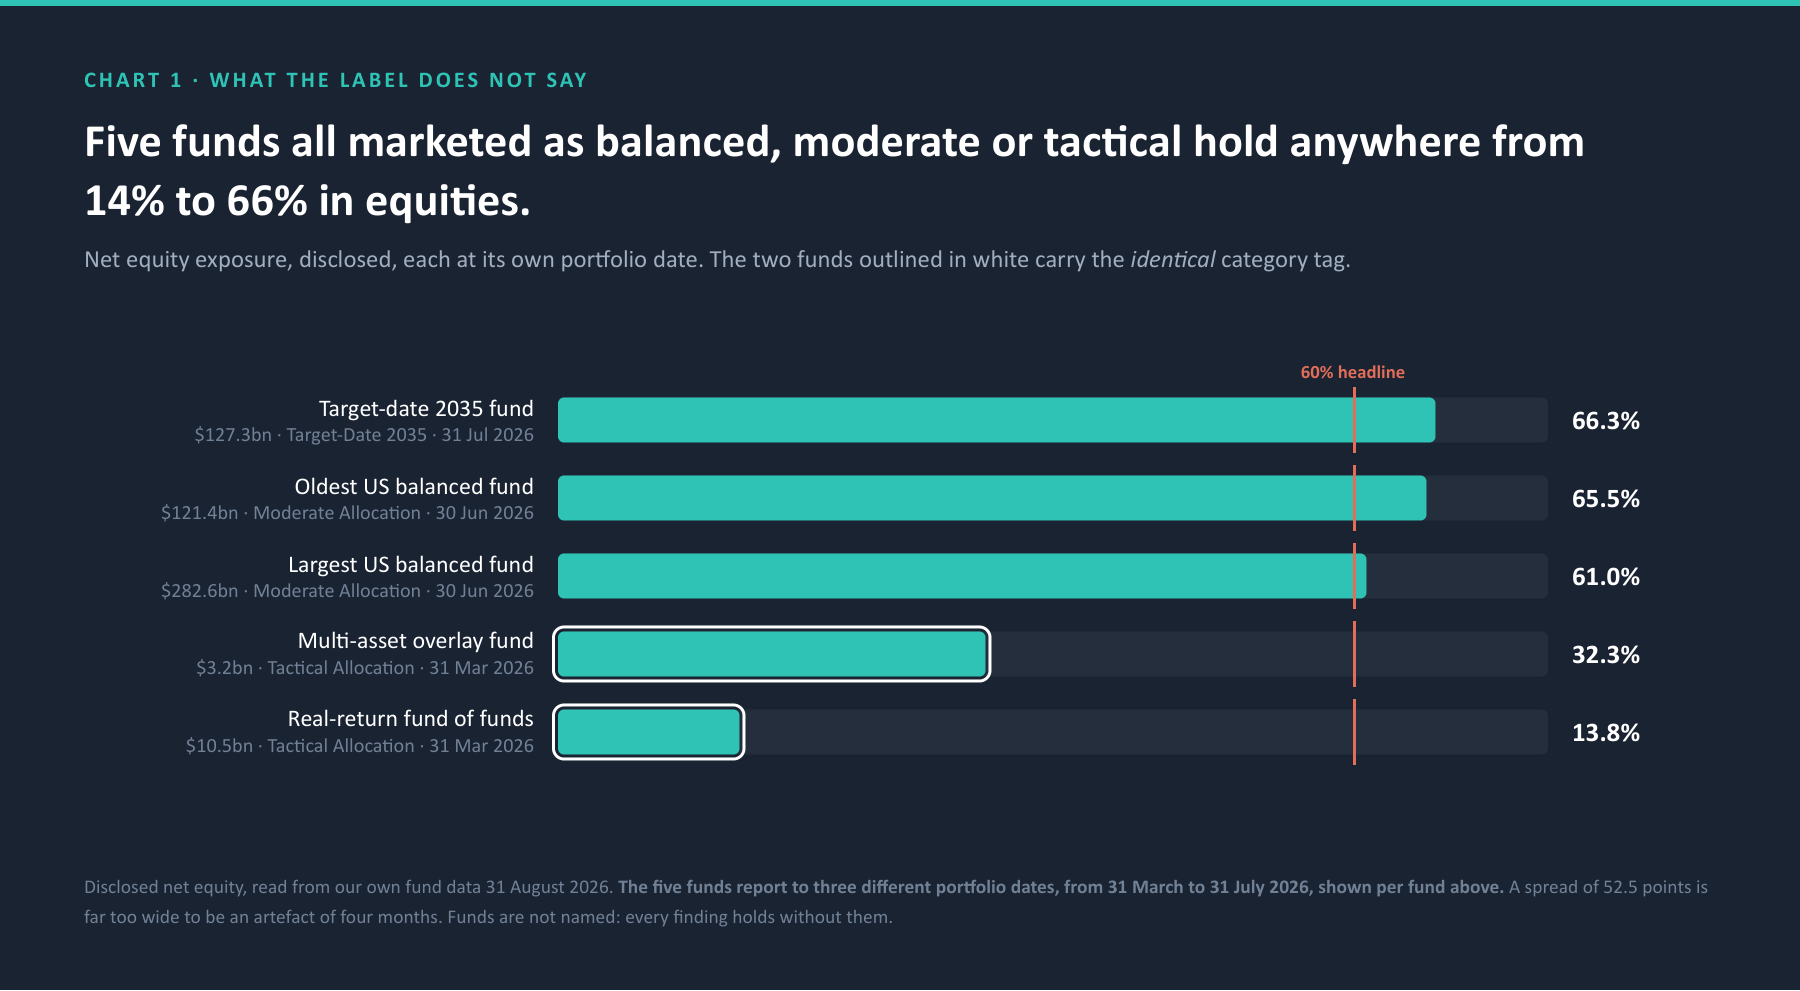
The two funds circled are the sharper finding. They do not merely sit at different points on a spectrum. They carry the identical category tag, and they sit 18.5 points apart on equity with unrelated strategies underneath. One runs trend and macro overlays. The other is a levered fund of funds built around inflation-linked bonds and real assets.
That second fund reports a cash position of minus 21.5 per cent. It is borrowing, through futures and repo, and the borrowing is disclosed in the filings. It is not disclosed by the words on the front of the fund. A plain-language allocation name gives no indication that leverage is present at all.
So the category tag is not a backstop
It fails in the same direction as the allocation label, and it fails for the same reason. Both describe what fraction of net asset value sits in a bucket. Neither describes what risk the portfolio is actually taking.
Hold the split at exactly 60/40 and the portfolios still diverge
The obvious objection is that those five funds are not really 60/40 vehicles, so of course they differ. Fair. So we removed the variable.
We built five portfolios that are precisely sixty per cent return-seeking and forty per cent risk-reducing, to the decimal, and changed only what sits inside each sleeve. Any divergence that survives is composition and nothing else.
It survives. Across the five, expected return spans 146 basis points and volatility spans 280 basis points, with no leverage and no exotic instruments anywhere in them. The concentration measure runs from 0.24 to 0.85 on a scale where 1.0 is a single holding, and the effective number of independent bets runs from 1.18 to 4.17.
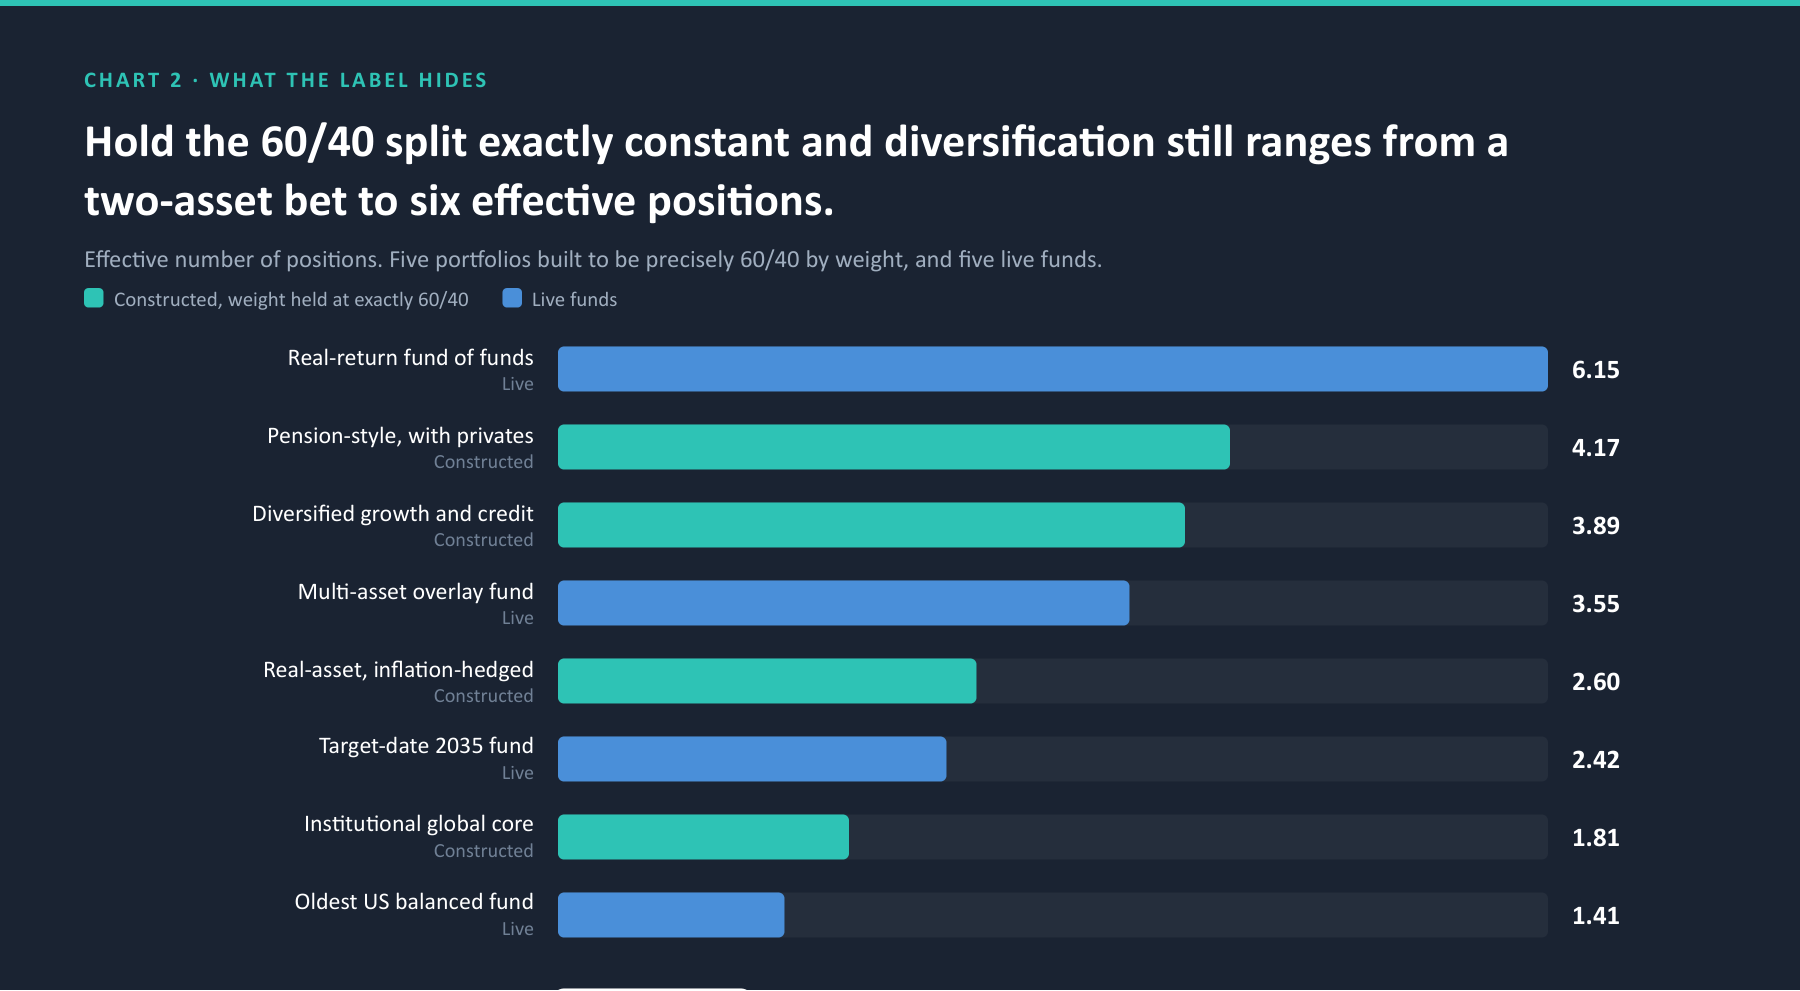
The classic domestic construction scores 1.18. It has a four-line allocation schedule and it behaves as a two-asset bet. The pension-style construction, built from the same sixty and forty, scores 4.17. Both are ours and both are re-derived.
The live funds sit across the same range and reach further at the top. Those scores are provisional pending independent re-derivation, so they are reported here as direction rather than as settled figures. On that basis two things stand out. The longest-running balanced fund in the set sits near the bottom, running one dominant exposure with a bond position attached. And two funds less than a point apart on the headline split, at 65.5 and 66.3 per cent equity, are materially different underneath, because one puts roughly a third of its equity sleeve outside its home market and the other does not.
The honest caveat, stated up front
Here is the part that a paper making this argument is tempted to bury.
Every one of these portfolios, constructed and live, is still dominated by a single factor. Growth beta explains the large majority of the variance in all ten. The creative ones are less dominated than the plain ones, but none of them escapes. If you were hoping that a cleverly built 60/40 becomes a genuinely balanced set of risks, it does not.
That does not weaken the argument. It sharpens it. The differentiation between these portfolios is real but it lives at the margins: in tail loss, in how much inflation protection is actually present, and in whether illiquidity has been taken deliberately or by accident. Those margins are exactly what the headline label cannot show you, and exactly what determines behaviour in the year the portfolio is tested.
The one portfolio in the set that scores best on risk efficiency is the one deliberately built against something other than growth beta. That is the tell. A book holding that profile under a 60/40 label made a choice. A book holding the concentrated profile under the same label may simply have inherited a default that nobody has interrogated since it was set. The label cannot distinguish between those two boards. It reports the same number for both.
Now change nothing in the portfolio and watch the answer move anyway
Everything above was computed on one house's capital market assumptions. That is standard practice, and it is also a choice, and the choice is not neutral.
We hold the published long-term assumptions of eight houses in one place, normalised to a common structure. So we took the simplest possible portfolio, sixty per cent US equity against forty per cent US core bonds, held it completely fixed, and priced it on each house's own numbers. Same weights, same currency, same ten-year horizon, same vintage.
| House | US equity | US core bonds | 60/40 blend |
|---|---|---|---|
| House A | 7.75% | 4.35% | 6.39% |
| House B | 7.60% | 4.30% | 6.28% |
| House C | 7.74% | 3.91% | 6.21% |
| House D | 6.70% | 4.60% | 5.86% |
| House E | 6.40% | 5.00% | 5.84% |
| House F | 6.20% | 4.20% | 5.40% |
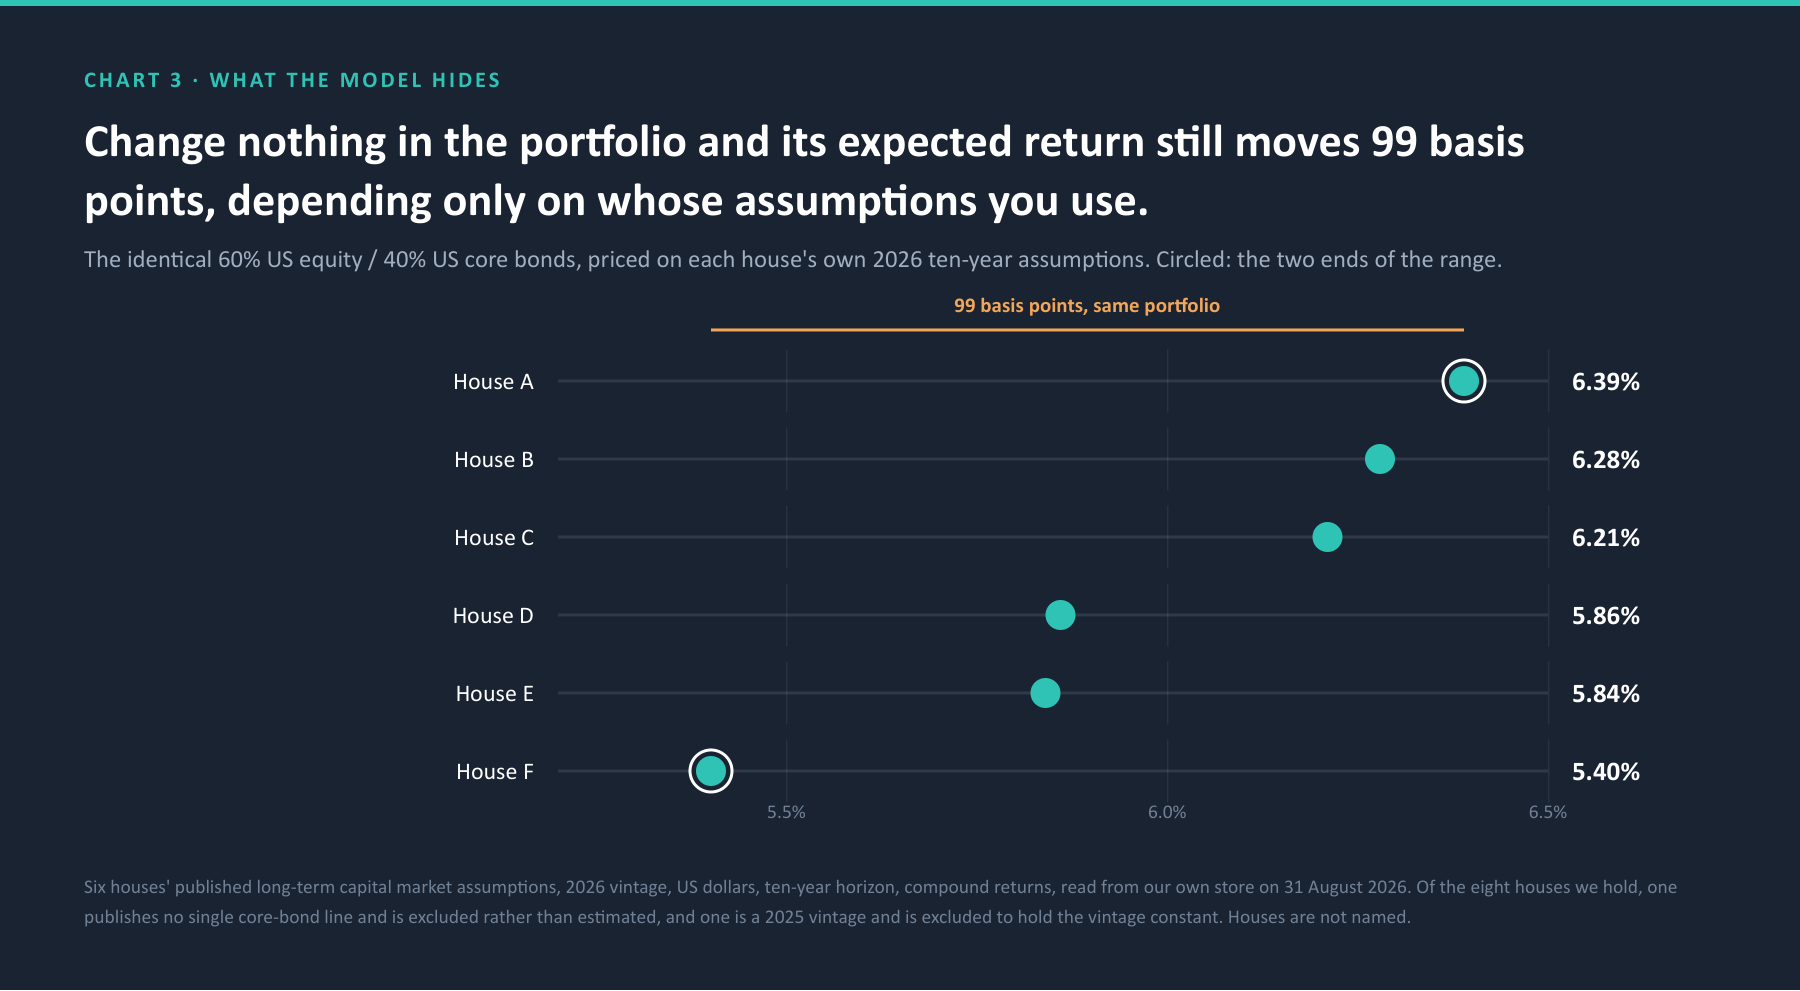
And the disagreement is not a simple optimism dial, which would at least be easy to adjust for. It is a disagreement about shape.
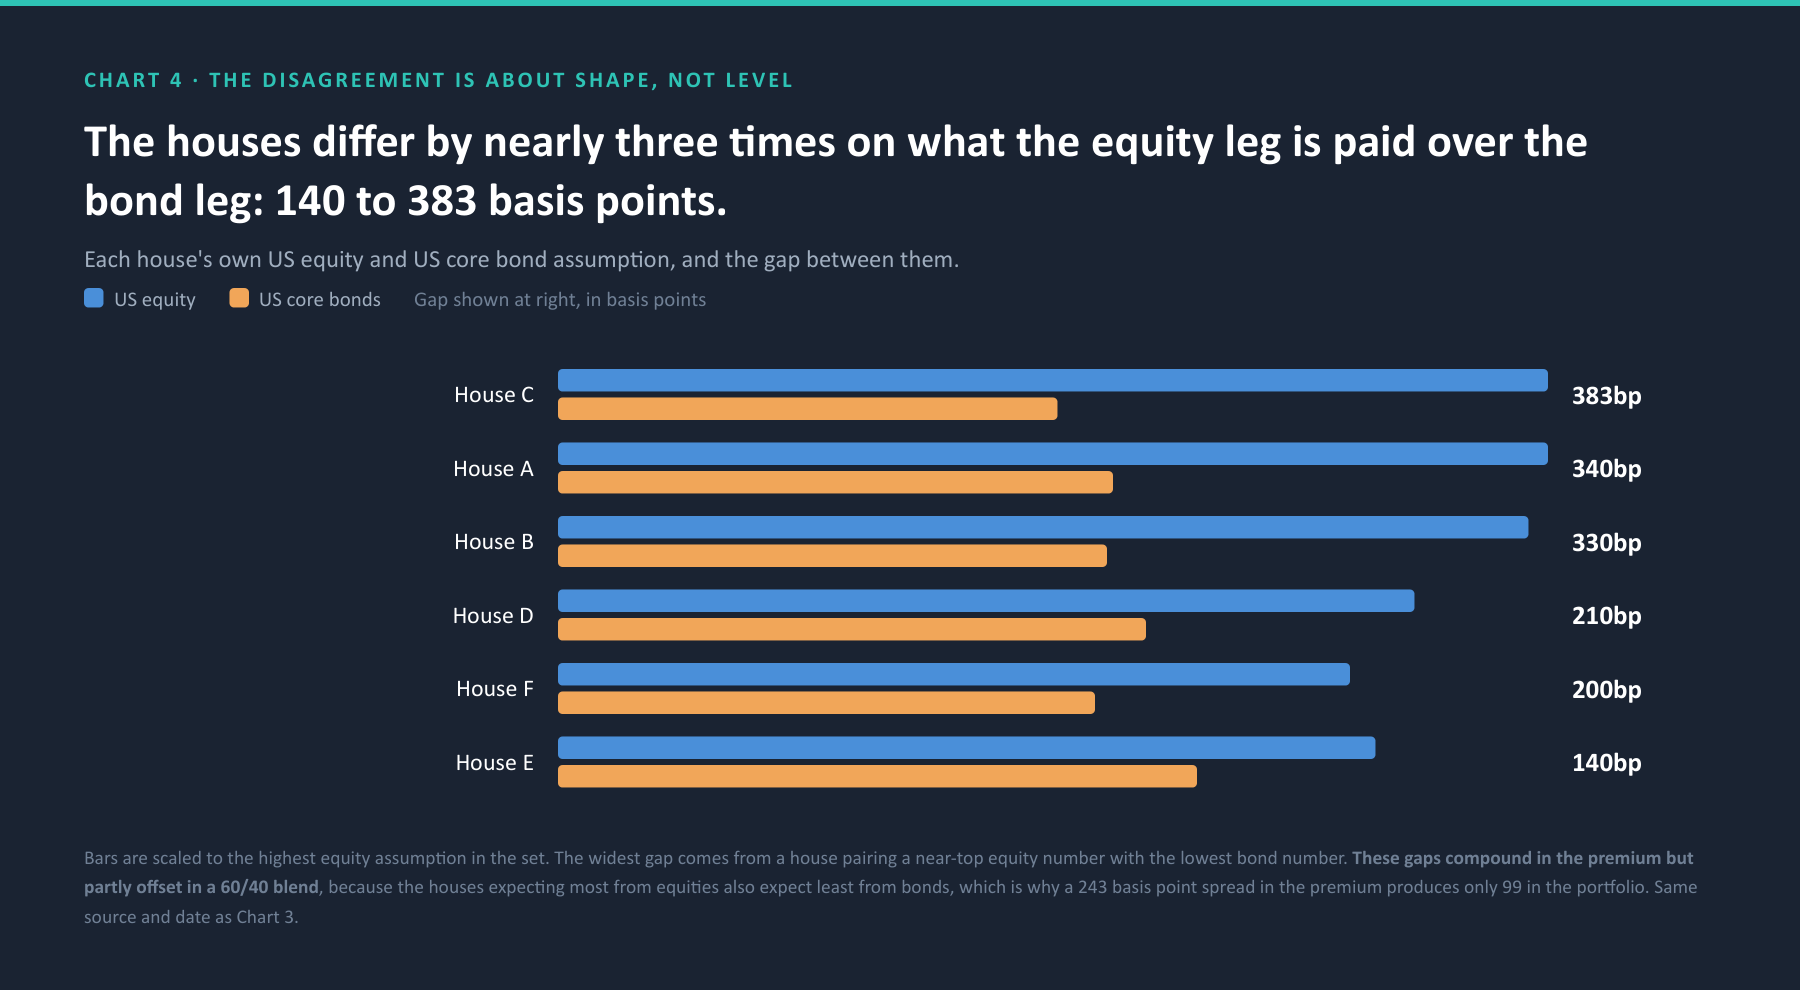
They differ by nearly three times on whether the sixty is worth having at all. Run an optimiser on the low number and it will tell you to hold less equity. Run it on the high number and it will tell you to hold more. Both are defensible published views from serious institutions.
What the blend then does to the disagreement
A 243 basis point spread in the premium, applied at a sixty per cent weight, would arithmetically produce about 146 basis points of portfolio spread. It produces 99. The reason is that the houses expecting the most from equities are also the ones expecting the least from bonds, so at the portfolio level the two disagreements partly cancel.
The 60/40 blend does not just hide what a portfolio holds. It hides how far apart the forecasters are. A committee looking only at the blended expected return sees a fraction of the disagreement that actually exists underneath it.
One further detail, because it is the sharpest of the lot. One of these houses publishes both an arithmetic and a compound expected return for the same US equity line, and the two differ by 124 basis points. That is a choice about which of two correct numbers to use, and on its own it is larger than the 99 basis points of disagreement between all six houses, and comparable to the 146 basis points of difference between five genuinely different portfolios.
The measurement choice outweighs the thing being measured
That should stop a committee in its tracks.
What to do about it
Not “60/40 is dead”. That argument has been made many times and it is not what this shows. What this shows is that the label is a classification, and a classification is not a risk statement. Three questions follow, and they are answerable in an afternoon.
What is actually inside the sleeves?
Not the asset-class percentages. The geography, the credit quality, the duration, and whether anything in the risk-reducing forty is behaving like equity when it matters.
How many independent bets is the book really running?
If the answer is close to one, the allocation schedule is decoration. That is a governance finding, not a performance finding, and it does not appear anywhere in a standard report.
Whose assumptions produced the expected return you are planning against?
And what happens to it under someone else's? If the number moves by a hundred basis points and nobody in the room knew it could, the planning conversation was never really about the portfolio.
None of these require a new mandate, a new manager or a new system. They require decomposing what is already there.
What we checked, and what we did not
The five funds report to three different portfolio dates.
Two at 30 June 2026, two at 31 March, and one at 31 July. Each is stated per fund on the first chart rather than averaged into a single as-at. A fifty-two and a half point spread in net equity is far too wide to be an artefact of four months, but the dates belong on the page.
The live funds' computed risk measures are provisional.
The effective-position scores for the five live funds are pending independent re-derivation and are reported here as direction rather than as settled figures. The five constructed portfolios' figures are ours and have been re-derived. The two sets are kept apart in the text for that reason.
The six-house mapping was declared by hand.
Each house names the same asset differently. A name match returned only four of them, because the others write it as US equity, US stocks and US large cap equities. That under-count would have halved the comparison without announcing itself, so the mapping is stated explicitly rather than matched on strings.
Two houses are excluded rather than estimated.
One publishes no single core-bond line and one is a different vintage. We would rather drop a data point than manufacture one, since the whole argument here is about what happens when choices are made invisibly.
The factor decomposition is not published here.
The growth-concentration caveat in section three is stated qualitatively, with no percentages, because the underlying decomposition is pending verification. It is the honest caveat to lead with rather than bury, and it is offered without a number attached.
The offer
If you run or oversee a balanced book, send us the allocation line. We will come back with what it actually holds, how many independent bets it is really running, and how much of its expected return is a modelling choice rather than a portfolio choice.
It takes us an afternoon. It is the question the label was never able to answer.
Important information
Publisher and purpose.
This material is published by Three Horizons Capital as part of its Intelligence Series. It is provided for general information and educational purposes only and reflects our views as of the date of publication, which are subject to change without notice. We are under no obligation to update it.
Not advice, not a recommendation, not an offer.
Nothing in this material constitutes, or should be construed as, investment, legal, tax, accounting or other advice, a research recommendation, or an offer, invitation or solicitation to buy, sell, subscribe for or transact in any security, fund or strategy. It is not a personal recommendation and does not take account of the objectives, financial situation, knowledge, experience or needs of any person. Three Horizons Capital is not a regulated entity.
No funds, houses, providers or issuers are named.
By editorial decision, no individual fund, manager, capital market assumption provider or ticker is identified anywhere in this material. Every finding here holds without the names, and two of them are adverse.
Scope and basis of our own figures.
Fund allocations and assets are derived from the Three Horizons Capital data platform and were re-derived there on 31 August 2026; four of the five reproduce exactly and the fifth differs by 0.13 of a point because our data has moved to a more recent portfolio date. Capital market assumptions were read on 31 August 2026 at a single vintage, currency and horizon, in US dollars, on a ten-year view, using compound returns throughout.
Constructed portfolios are illustrations.
The five constructed portfolios were built to isolate one variable. They are not model portfolios, nobody is invested in them, and they are not offered as an allocation.