Priced versus realized
All of the Risk, None of the Premium
A private strategy's liquid twin earned exactly what the index earned, and charged more than twice the volatility to do it. The quarterly appraisals of the private vehicles show nothing resembling that ride, and the reporting calendar does not explain the difference.
Three Horizons Capital | 31 August 2026 | Monthly, 30 December 2022 to 31 July 2026, 43 observations | US dollars | Returns derived from adjusted closing prices, not from a pre-computed return field | For professional investors | No fund, manager, pension system or listed security is named
21.5%
the liquid twin's annualised return over 43 months, against 22.2% for the index over exactly the same window
2.2x
the volatility it charged to get there, 30.6% against the index's 13.8%, and a 36.5% fall against 9.8%
30.8%
the drawdown still visible when you look only four times a year, exactly as an appraisal cycle would
Almost every private strategy is hard to study, because nothing liquid holds the same thing. One is the exception.
The cash flow it buys, a minority claim on a manager's fee income and carried interest, is also the cash flow that listed asset managers report as their own earnings. So the same economics exist in two places at once: appraised quarterly inside a fund, and priced every morning on an exchange. That accident of structure lets us ask a question that is normally unanswerable. What would the risk of a private holding look like if somebody had to put a price on it every day?
The governing thought
Over this window the extra risk earned nothing at all. Priced openly, the same economics delivered the index return at more than twice the volatility. An allocator holding it in appraised form saw a smooth line and a respectable internal rate of return, and had no way to see it.
What the appraisals say
Read at face value, the reported record describes a calm asset. Net internal rates of return land in a wide but unremarkable band. Distributions relative to capital paid in sit below one times for most of the vehicles, which is normal for a strategy whose cash arrives as a slow drip of fee revenue rather than as exit proceeds. Values step up most quarters.
They are not purely one-directional, and an early version of this analysis was wrong to say so. Looking quarter by quarter rather than at the latest mark, several vehicles show genuine markdowns. They are small, and they are occasional. Nothing in the appraised record resembles the path in the next chart.
The same destination, at more than twice the risk
So put the same money to work in both places on the same day and follow it for 43 months. The destinations turn out to be almost identical. The journeys are not comparable at all.
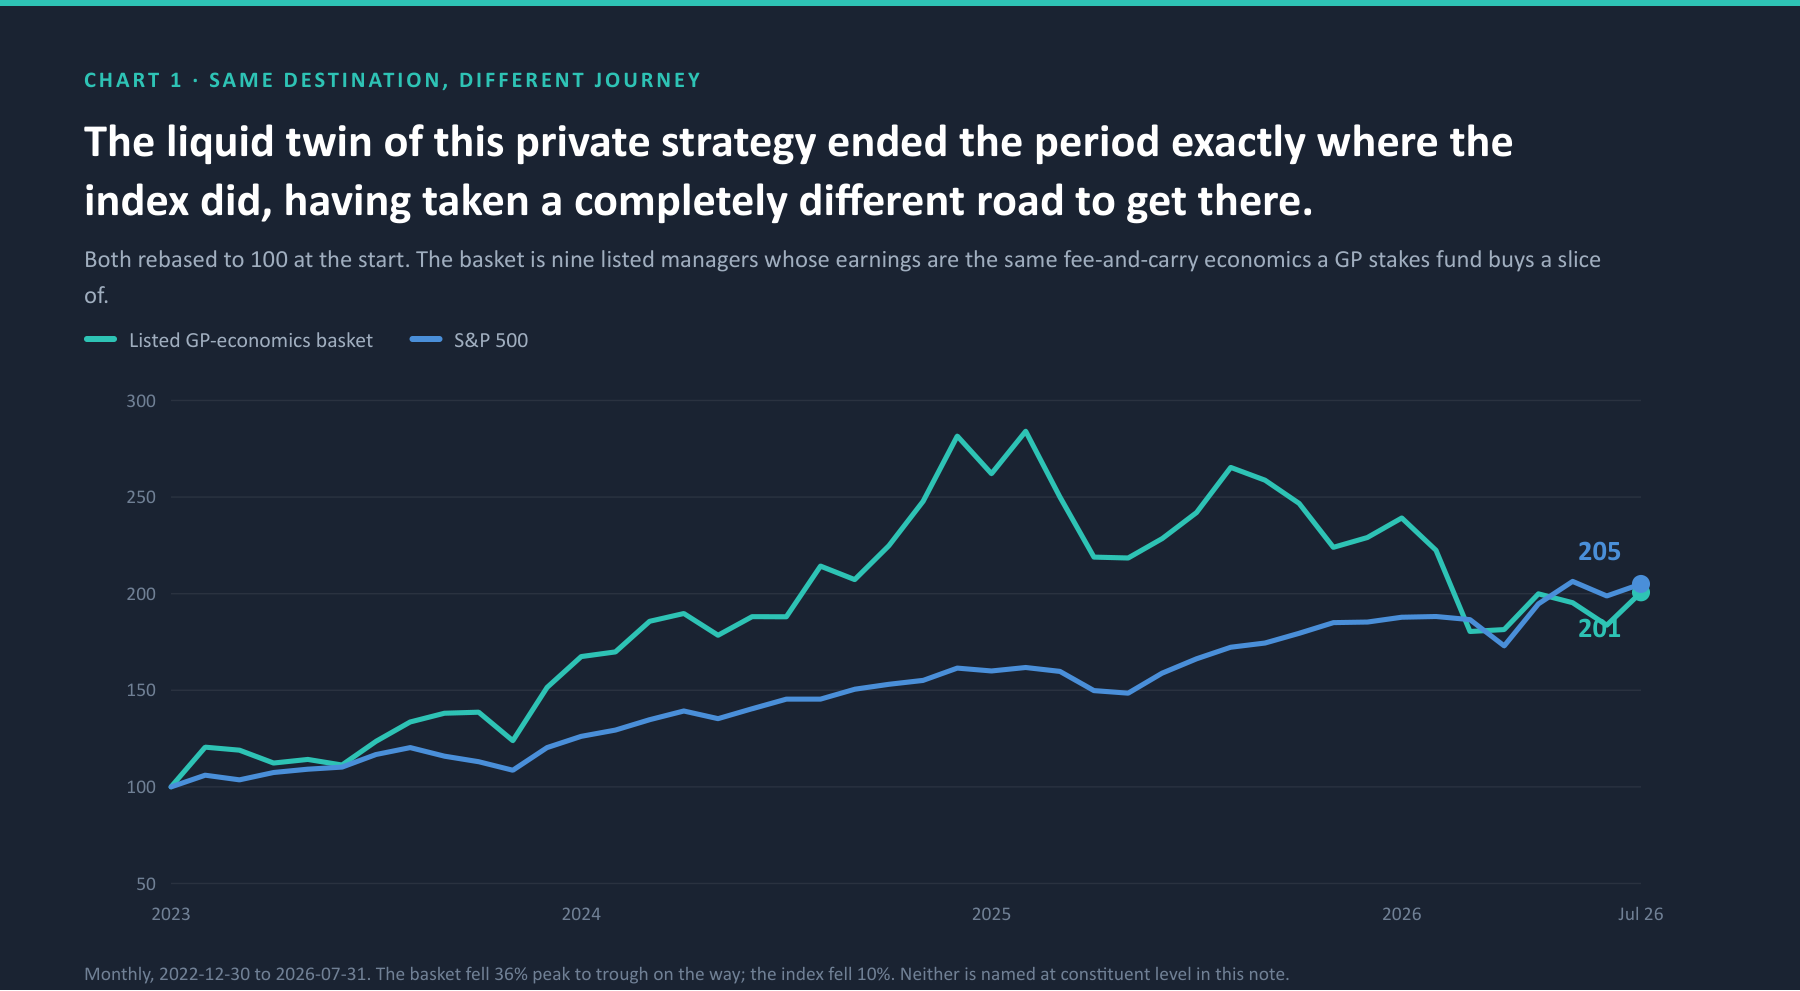
The two lines arrive at almost the same place. One of them takes a route the other never goes near.
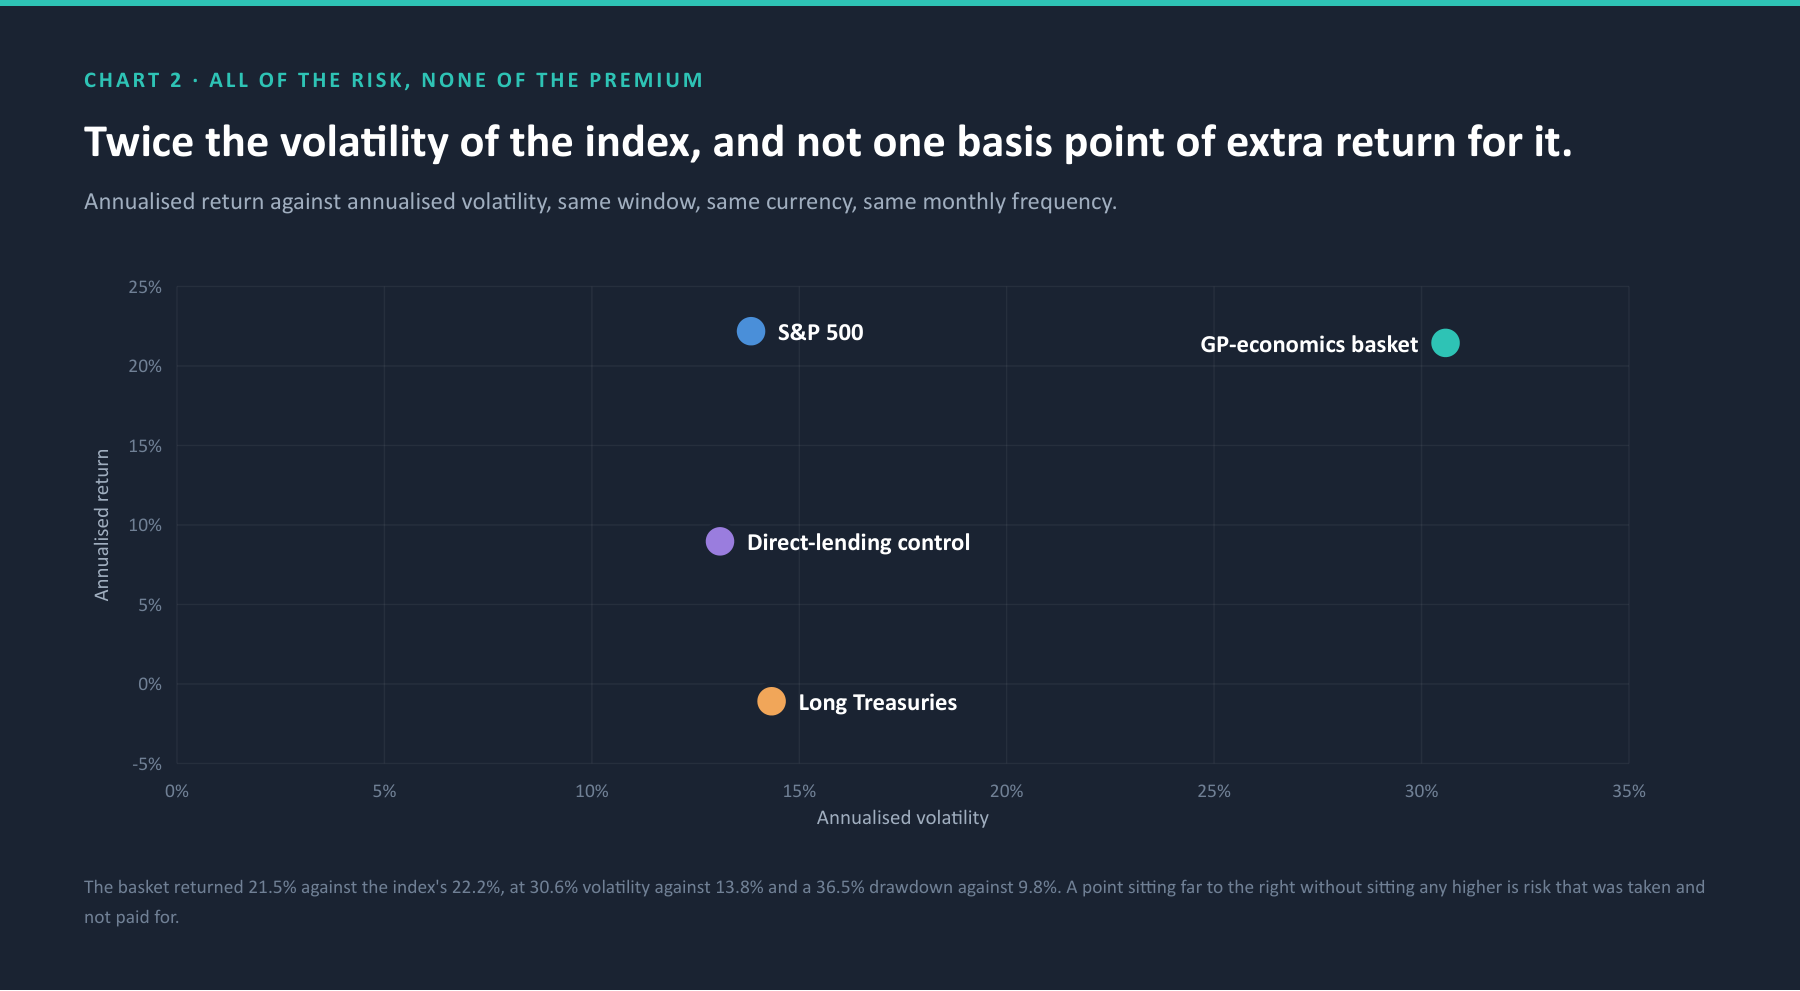
Two points at the same height, one of them a long way to the right. That is the finding. Not that the exposure was risky, which anyone might guess, but that the extra risk was not paid for. A point sitting far to the right without sitting any higher is risk that was taken and not rewarded.
The reporting calendar is not the explanation
The obvious defence is that private vehicles are marked quarterly, so of course the path looks smoother. That defence is testable, and it does not hold.
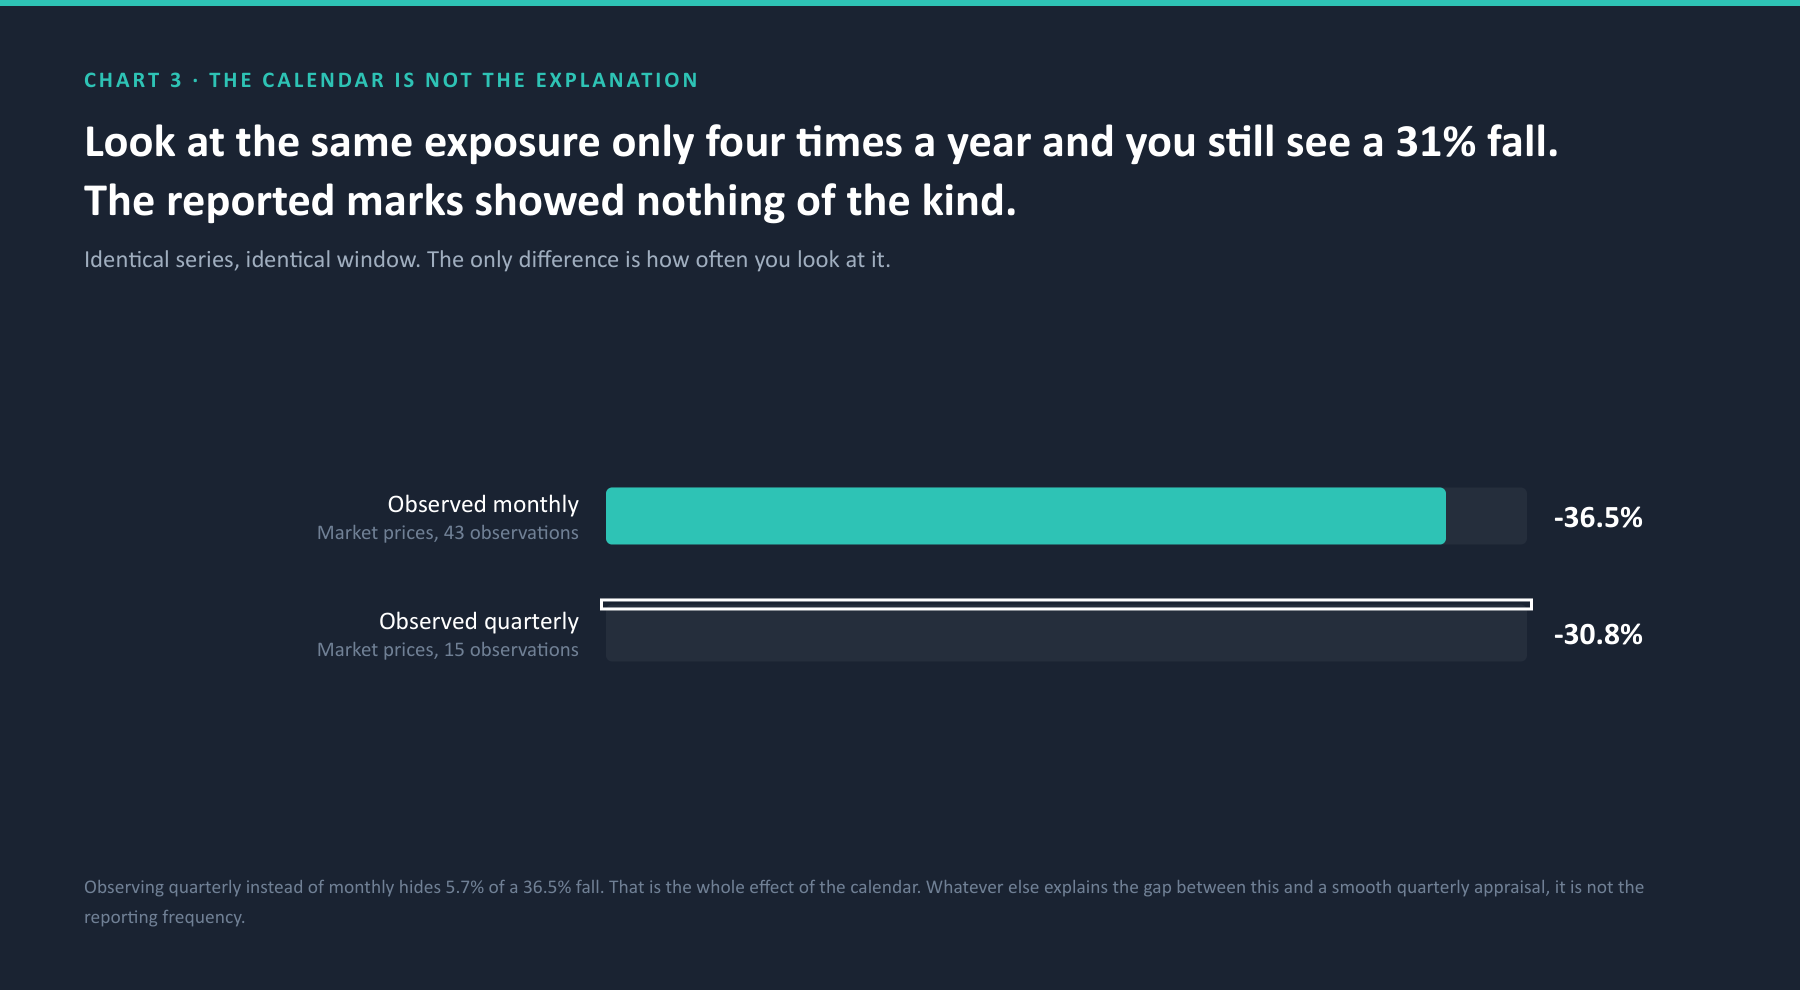
Take the identical basket and look at it only at quarter ends, exactly as an appraisal cycle would. The drawdown you would have observed is 30.8%, against 36.5% monthly. Looking less often removes 5.7 points of a 36.5 point fall, and that is the entire effect of the calendar.
So a quarterly observer still sees a third of the value go
A quarterly observer of market prices would have watched roughly a third of the value disappear. The appraisals showed nothing of the kind. Whatever accounts for the difference, it is the valuation method and not the reporting frequency. That distinction matters, because frequency is the part everybody already knows about.
There was never a diversifier here to break
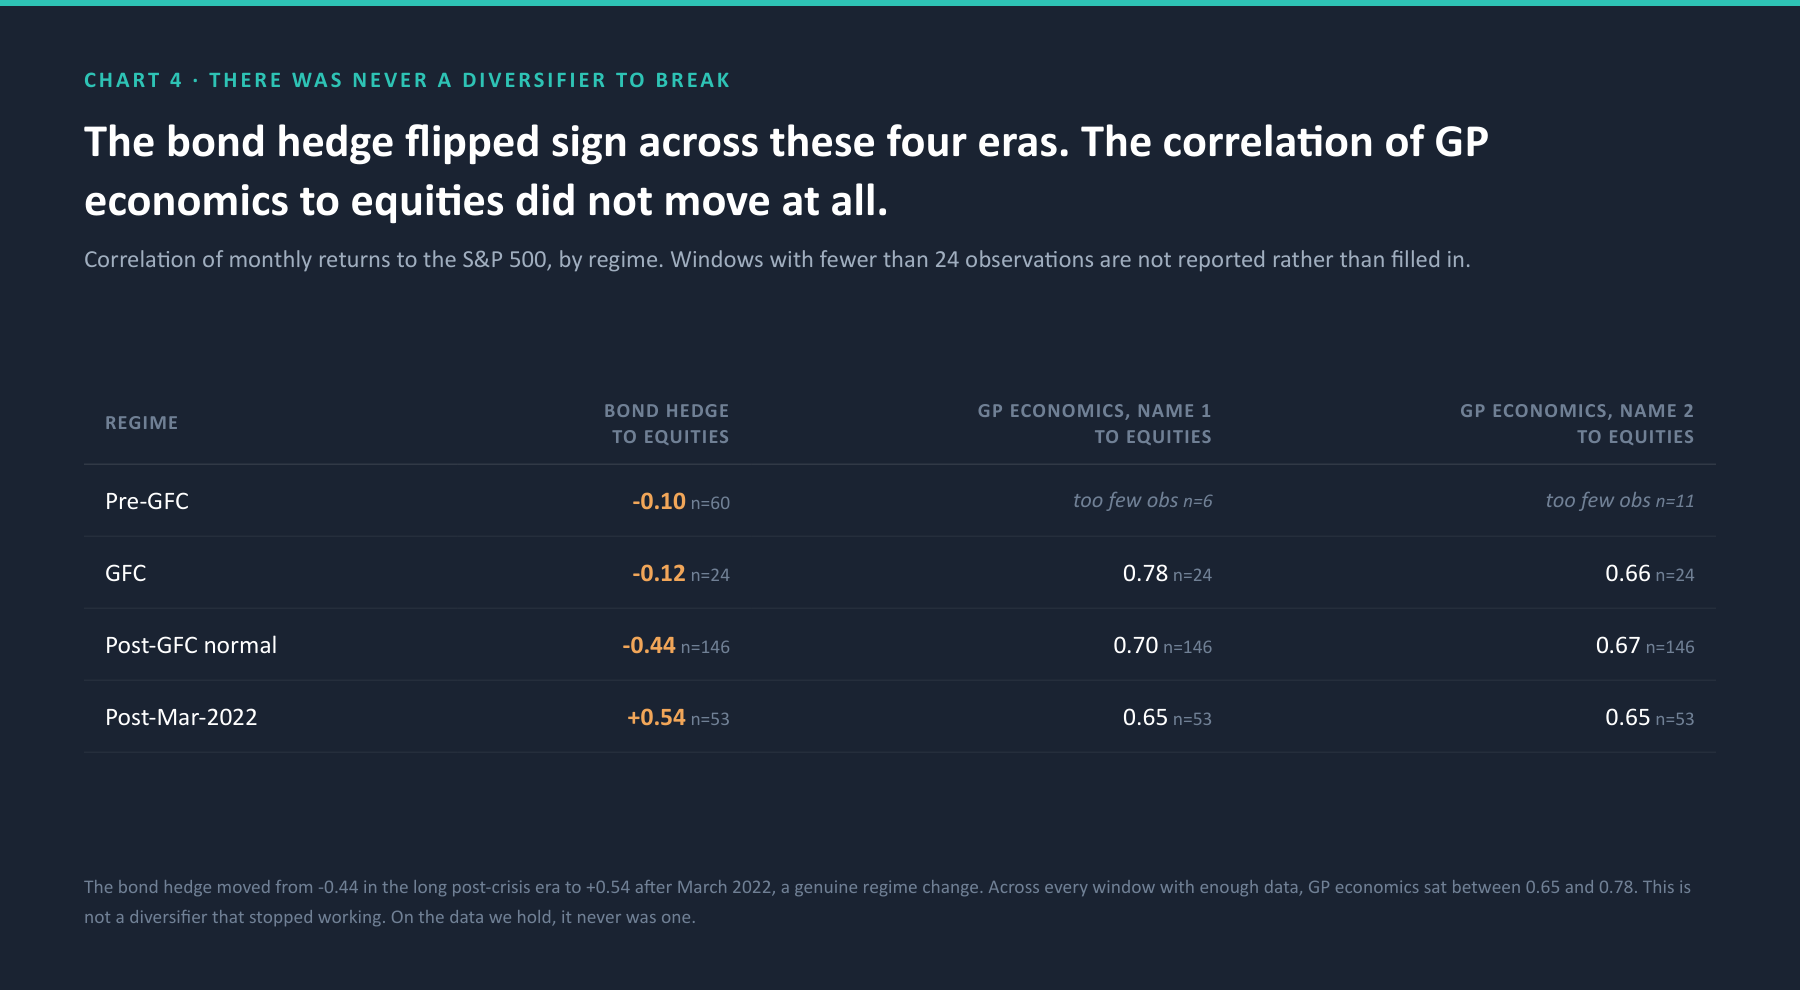
| Regime | Bond hedge | These economics, 1 | These economics, 2 |
|---|---|---|---|
| Pre-crisis | -0.10 | not reported | not reported |
| Crisis | -0.12 | 0.78 | 0.66 |
| Post-crisis | -0.44 | 0.70 | 0.67 |
| After March 2022 | +0.54 | 0.65 | 0.65 |
Correlation of monthly returns to equities. Two cells are left empty because fewer than 24 observations is not a correlation.
The bond hedge did what everyone now knows it did. It moved from -0.44 across the long post-crisis era to +0.54 after March 2022. That is a genuine regime change, and it is why so many balanced portfolios behaved unexpectedly.
This exposure did not participate in that story. In every window with enough observations to report a correlation honestly, it sat between 0.65 and 0.78 against equities, and the highest reading of the three is the crisis window. It did not stop diversifying in 2022, because on the data we hold it was never diversifying. That is a sharper caution than a broken-hedge story, because a broken hedge sounds like bad luck and this does not.
The strongest objection, and what survives it
The serious reply is this. The holding is genuinely illiquid, so daily volatility is somebody else's problem. Nobody can force a sale, the appraisal is the number that governs, and a path you cannot trade is not a risk you bear.
That objection is largely right, and it is why this note argues for repricing rather than for selling. Illiquidity changes your behaviour, which is genuinely valuable, but it does not change the underlying asset. The distinction stops being academic at the moments when the appraisal has to meet the world: when you need liquidity, when you rebalance against the sleeve, and when the risk model tells the board how much total risk the book is running.
What to do about it
Not sell. There is usually no way to sell, and the strategy may well be a perfectly good one. The issue is measurement, and measurement is inside your control.
Most institutional risk systems carry a private sleeve at the volatility its own marks imply. Feed a smoothed number into a risk model and the model understates total portfolio risk, by the most in the place you have grown the allocation hardest. That is a modelling input you own, and you can change it this quarter without touching a single holding.
Find out what volatility your risk model is currently using for each private sleeve.
In most books nobody has looked, and the answer is frequently the appraised series itself.
Build a liquid analogue for each sleeve where one plausibly exists.
Carry its observed volatility and correlation into the risk model instead. Not every sleeve has a clean twin. Some do.
Use the analogue as an interim check between appraisal dates.
It will not tell you what your holding is worth. It will tell you whether the last mark is still a reasonable description of the world.
What we checked, what we cannot see, and what we got wrong
The comparison is a proxy, and the populations do not match.
The basket is nine of the largest listed managers. The private strategy buys minority stakes in mid-sized and emerging managers. Our own look-through confirms no overlap between the two sets, and would not expect any. The basket represents the type of cash flow, not the population, so every comparison here is about the economics rather than about specific holdings.
Every return is rebuilt from adjusted closing prices, because a pre-computed field in our own data was wrong.
While building this we found a return field that does not describe the same period as the monthly row it sits on. Across the nine names, 370 of 383 monthly comparisons disagree with the price-derived return by more than half a point, with a median gap near six points and a worst month of thirty-six. Every series here is therefore rebuilt from prices, and the defect has been raised internally rather than quietly worked around.
The two series come from different tables at different frequencies.
Benchmarks sit in a weekly table, the basket in a monthly one. Both are cut to one common set of month ends, which is why the window is stated precisely rather than loosely. The source version of this work did not do that, and the three-week mismatch it left was large enough to reverse the conclusion.
Correlations are reported only where there are at least 24 monthly observations.
Two of the twelve cells in the regime table are left empty for that reason rather than filled in. An earlier version of this work reported a correlation for a period in which one of the securities had barely started trading.
The appraisal record is thin, and it is worth being precise about how thin.
Of the 431 institutions we track, 31 disclose any private-markets performance data at all, and the relevant vehicles are matched on fund naming rather than on a strategy classification, because the strategy field is empty for every one of them. There are known defects in the record too, including at least one commitment captured in the wrong units and one manager appearing under both a legacy and a current name. None of that is a reason to distrust the appraisals. It is a reason to be careful how much any conclusion drawn from them is asked to carry.
We got something wrong, and it is stated rather than buried.
An earlier version of this analysis said the appraised values only ever rise. That was wrong. Re-reading the quarterly record rather than the latest mark corrected it: small markdowns do occur. The argument does not depend on their absence.
The repricing note
Send us one line describing a private sleeve: what it holds, and roughly how big it is. We will come back with a single page. Its appraised volatility against the observed volatility of the closest liquid analogue, the same for drawdown, the correlation to your listed book, and what the difference does to your total portfolio risk number.
No holdings data required, no engagement required, and the method is set out above in enough detail to run it yourself if you would rather.
Important information
Publisher and purpose.
This material is published by Three Horizons Capital as part of its Priced Versus Realized series. It is provided for general information and educational purposes only and reflects our views as at the date of publication, which are subject to change without notice. We are under no obligation to update it.
Not advice, not a recommendation, not an offer.
Nothing in this material constitutes, or should be construed as, investment, legal, tax, accounting or other advice, a research recommendation, or an offer, invitation or solicitation to buy, sell, subscribe for or transact in any security, fund or strategy. It is not a personal recommendation and does not take account of the objectives, financial situation, knowledge, experience or needs of any person. Three Horizons Capital is not a regulated entity.
No fund, manager, pension system or security is named.
By editorial decision, no individual fund, sponsor, public pension system or listed security is identified anywhere in this material. Every finding here holds without the names, and the findings are adverse to reported practice.
Scope and basis of our own figures.
All figures are derived from the Three Horizons Capital data platform and were frozen to a single derivation on 31 August 2026, from which the charts and the text both read. The window is monthly, 30 December 2022 to 31 July 2026, in US dollars, 43 observations. Returns are derived from adjusted closing prices, not from a pre-computed return field.
Past performance is not a guide to future results.
The window studied is 43 months and covers one market cycle at most. A different window would produce different figures. The finding concerns the relationship between measured risk and realised return over this period, not a forecast of either.