Distribution intelligence
Allocate Your Relationships Like Capital
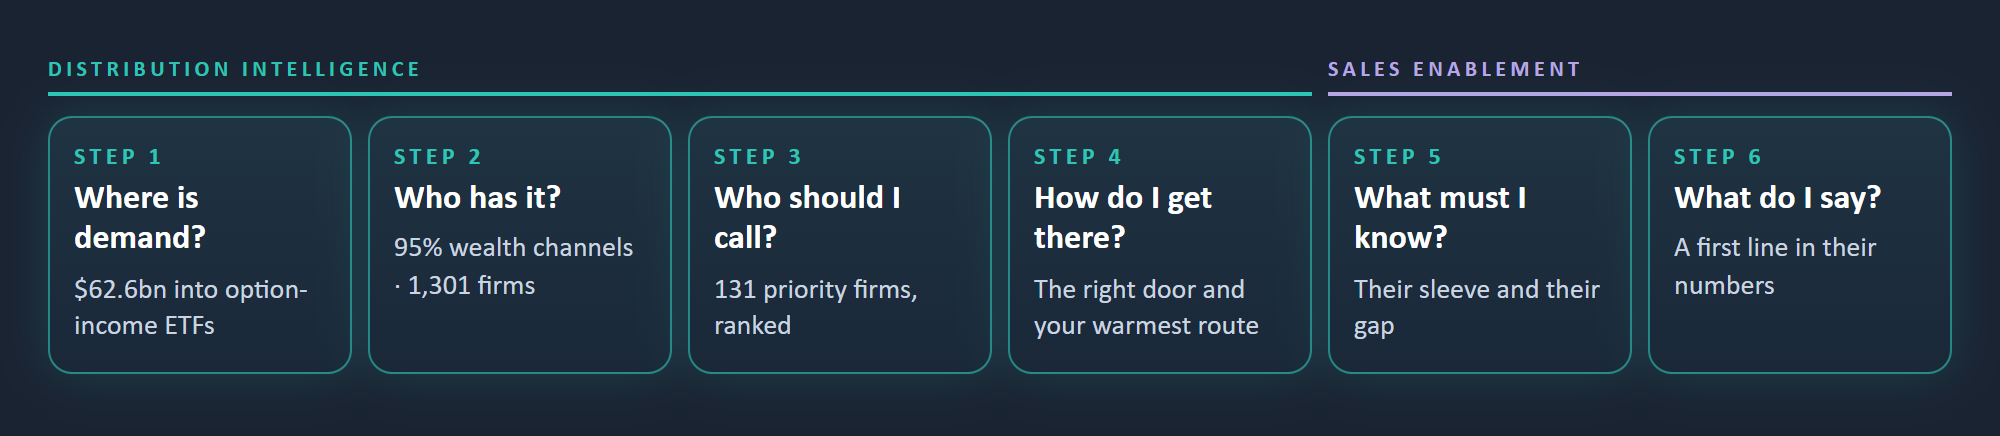
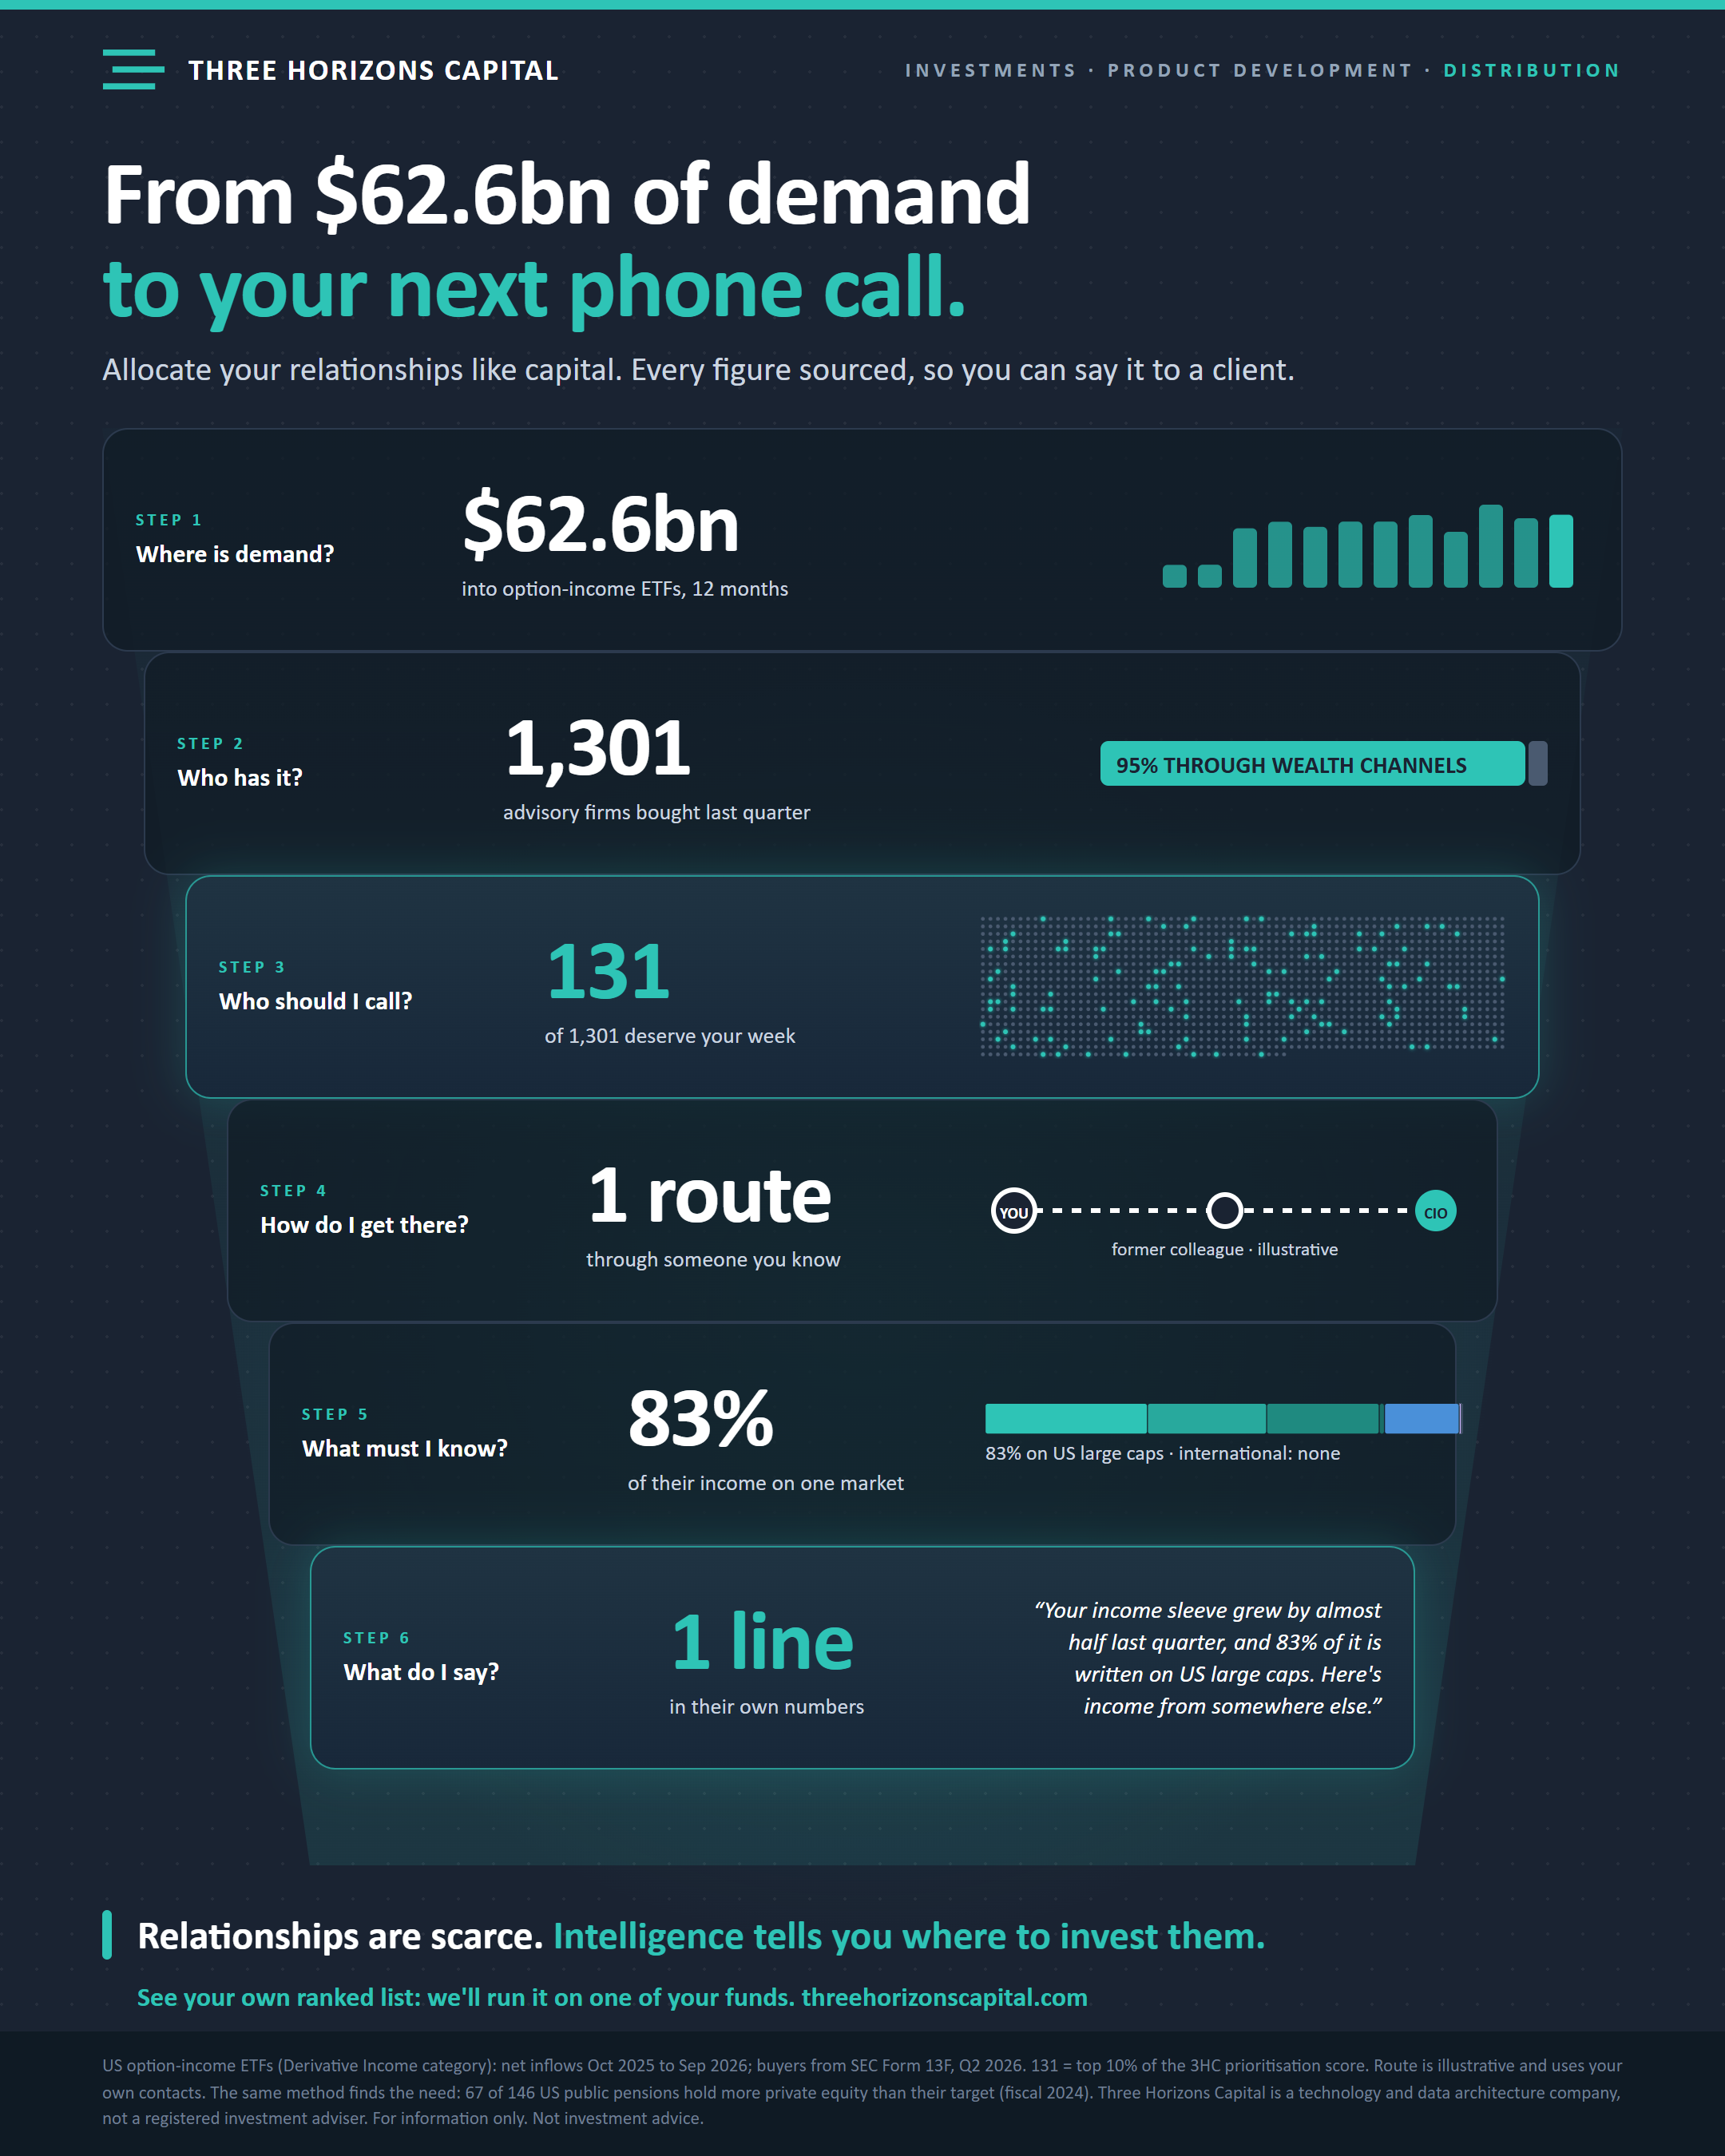
From $62.6bn of demand to your next phone call: where demand is forming, who has it, who to call, how to reach them, and what to say.
Three Horizons Capital, Research. October 2026. US ETF flows to September 2026; SEC Form 13F holdings to 30 June 2026; Form ADV 2026; US public pension annual reports, fiscal 2024. US dollars.
$62.6bn
Net inflows into US option-income ETFs in the twelve months to September 2026, positive every month
1,301 → 131
Advisory firms that bought last quarter, and the 131 priority firms that deserve your week
119 of 131
Priority firms that are new to the category or accelerating their buying
The finding in one line
Most pipelines are an equal-weighted index. Ranking prospects on probability, revenue and timing, then finding the route in, turns 1,301 names into 131 conversations worth having.
Your pipeline is a portfolio
Asset managers know how to allocate capital. Why don't they allocate their distribution time the same way? To decide where to invest, they use research, analytics and risk models: estimate the return, size the position, cut what isn't working. In most firms, distribution still runs on relationships, intuition, spreadsheets and what individual salespeople carry in their heads. Relationships are the scarcest asset in distribution, and most pipelines treat every prospect alike.
Buyers have less time than ever: they spend 17% of their buying time with all suppliers combined, and 73% avoid suppliers who send irrelevant outreach (Gartner). What institutions reward is understanding: 59% use "strategic partner" managers, who run 62% of their assets (Coalition Greenwich, 2025).
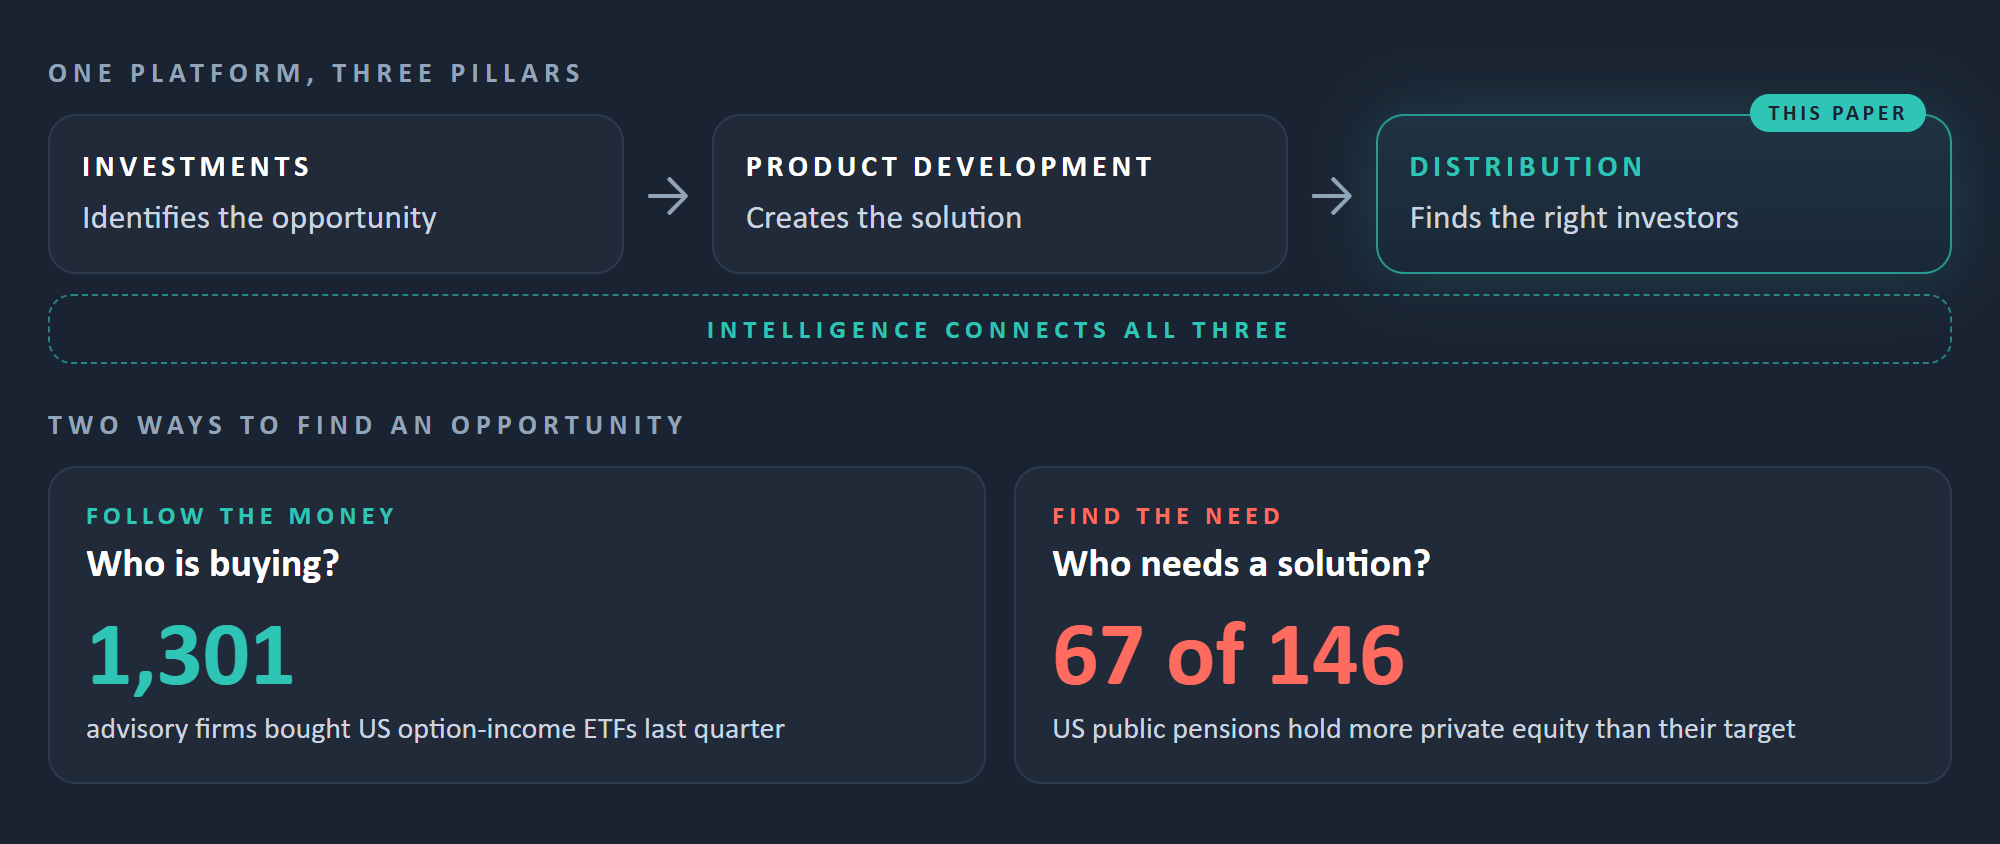
Investment intelligence identifies opportunities, product development creates the solutions, and distribution finds the right investors. Intelligence connects all three. This paper is about Distribution, and it finds opportunities in two ways: follow the money (who is buying) and find the need (who needs a solution).
The Intelligence Analyst
The Intelligence Analyst is the distribution and sales engine of 3HC Intelligence, built by practitioners from large asset managers. It shows you where demand is forming, who to call and what to say, from a curated data spine of fund flows, holdings filings and regulatory disclosures. Every figure in your brief traces back to its source, or it tells you it can't, so you can put it in front of a client.
Where is demand?
Start with the money. US option-income ETFs, the Derivative Income category, took $62.6bn of net inflows in the twelve months to September 2026, across 138 funds. Money went in every single month, and $17.0bn of it between April and June.
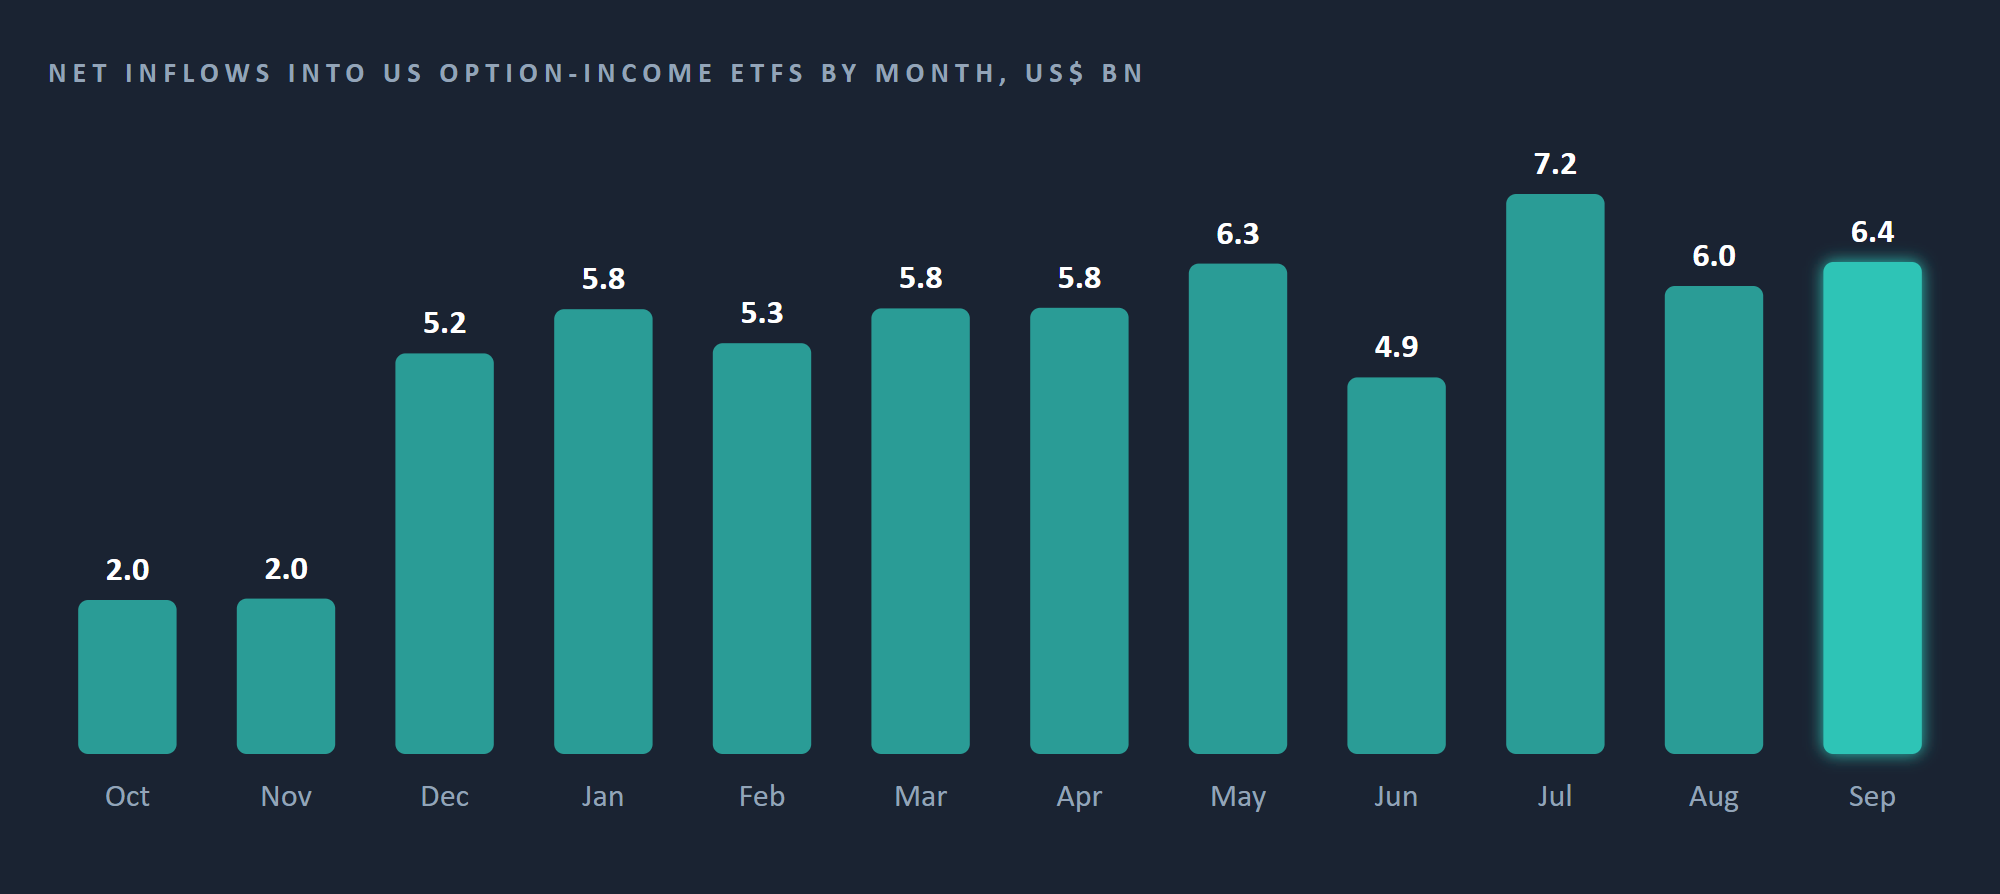
A flow chart is where most distribution analysis stops. It tells you what was bought. It does not tell a salesperson who bought it, who will buy next, or who to call on Monday.
Who has it?
Quarterly US holdings filings show who bought $5.5bn of the $17.0bn that went in between April and June. The answer is not the institutions. 95% of the visible buying came through wealth channels: independent broker-dealers, wirehouses and bank wealth groups, independent RIAs and RIA aggregators. 1,301 independent advisory firms bought in the quarter, each named in a public filing.
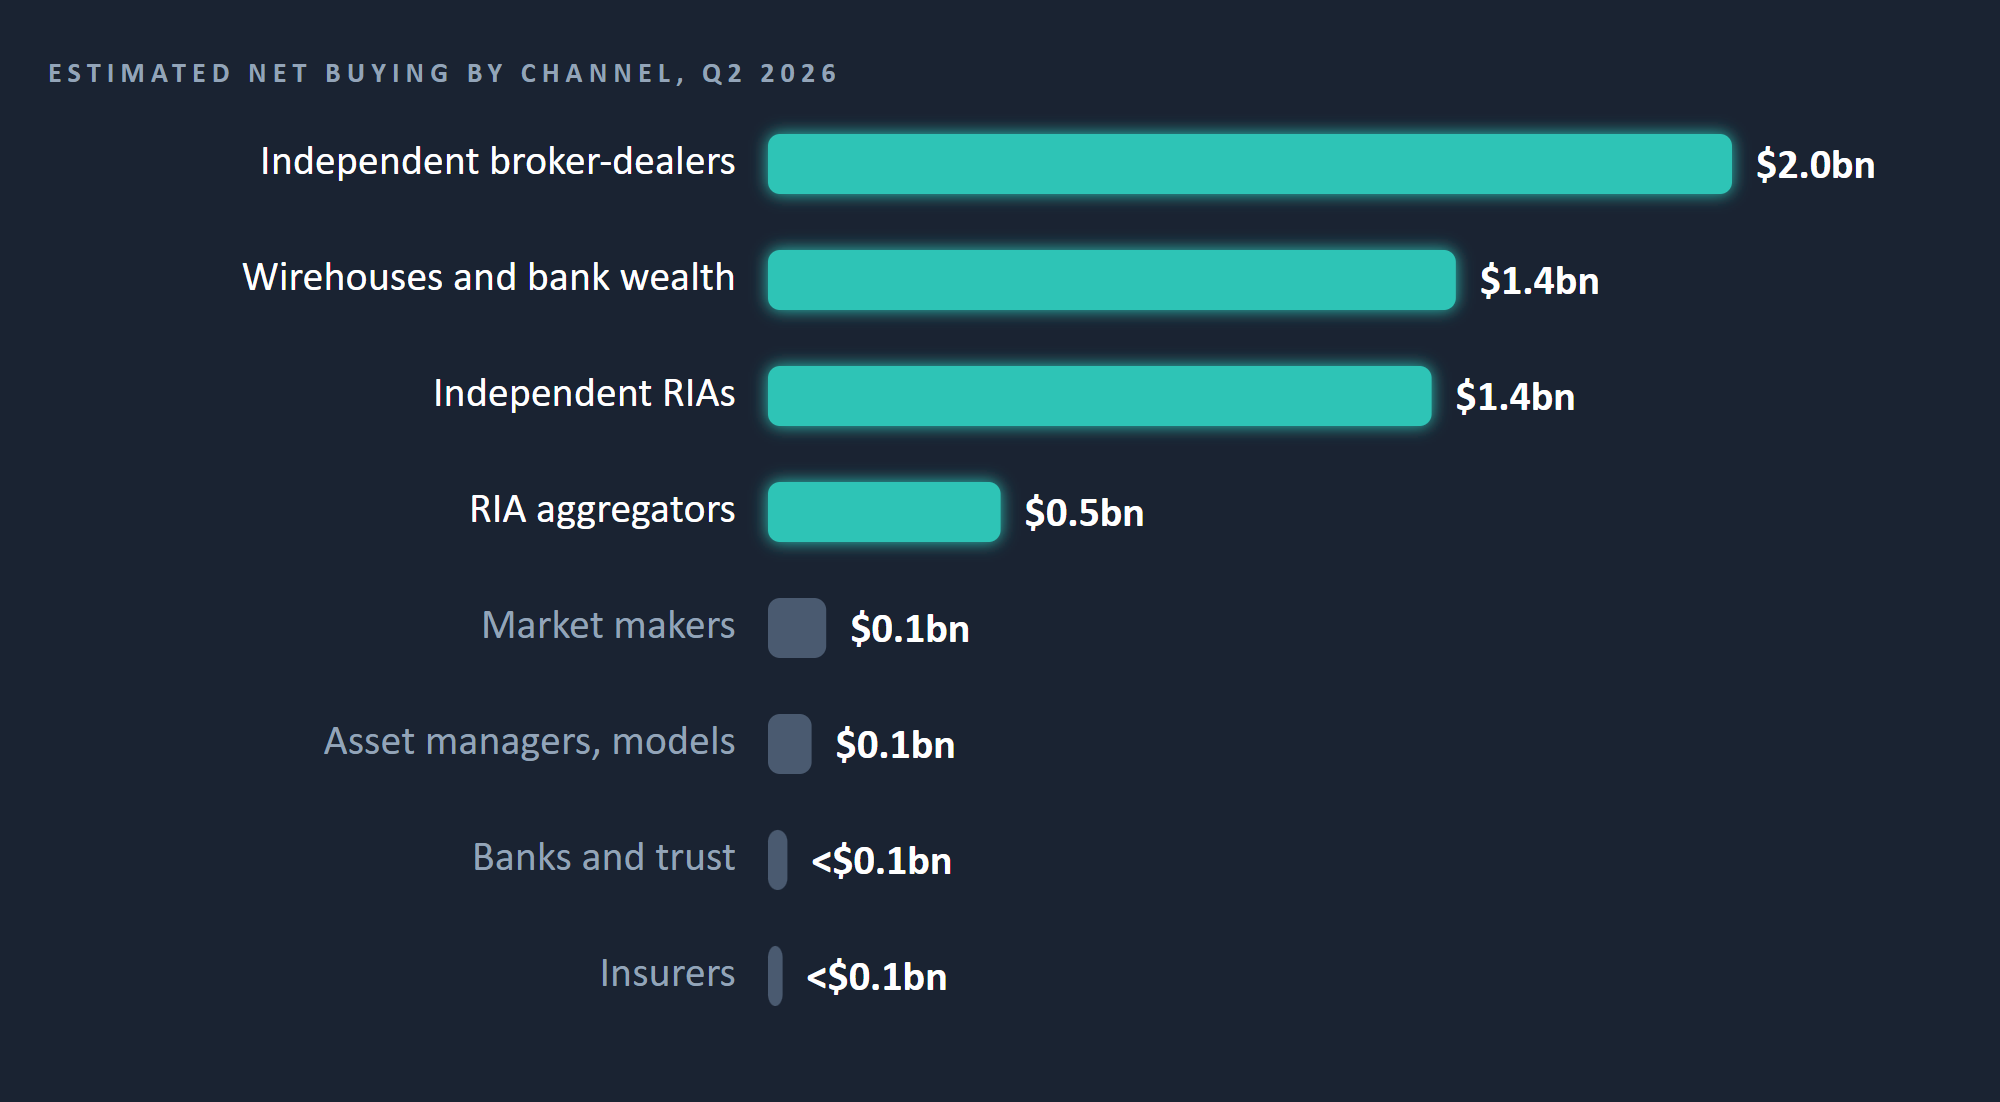
What the filings show is the direction of demand, not a census: they cover firms managing more than $100m, each quarter, about a third of the money in this category. Self-directed investors and smaller advisers sit outside them. That is enough to know this is a wealth product, sold through platforms, model teams and advisers. And nobody can call 1,301 names.
Who should I call?
Rank prospects the way you would rank investments. Every buying firm gets a score: probability (how hard it is leaning in) × revenue (how big it is) × timing (whether now is the moment). The top 10% of scores, 131 firms, form the priority ring.
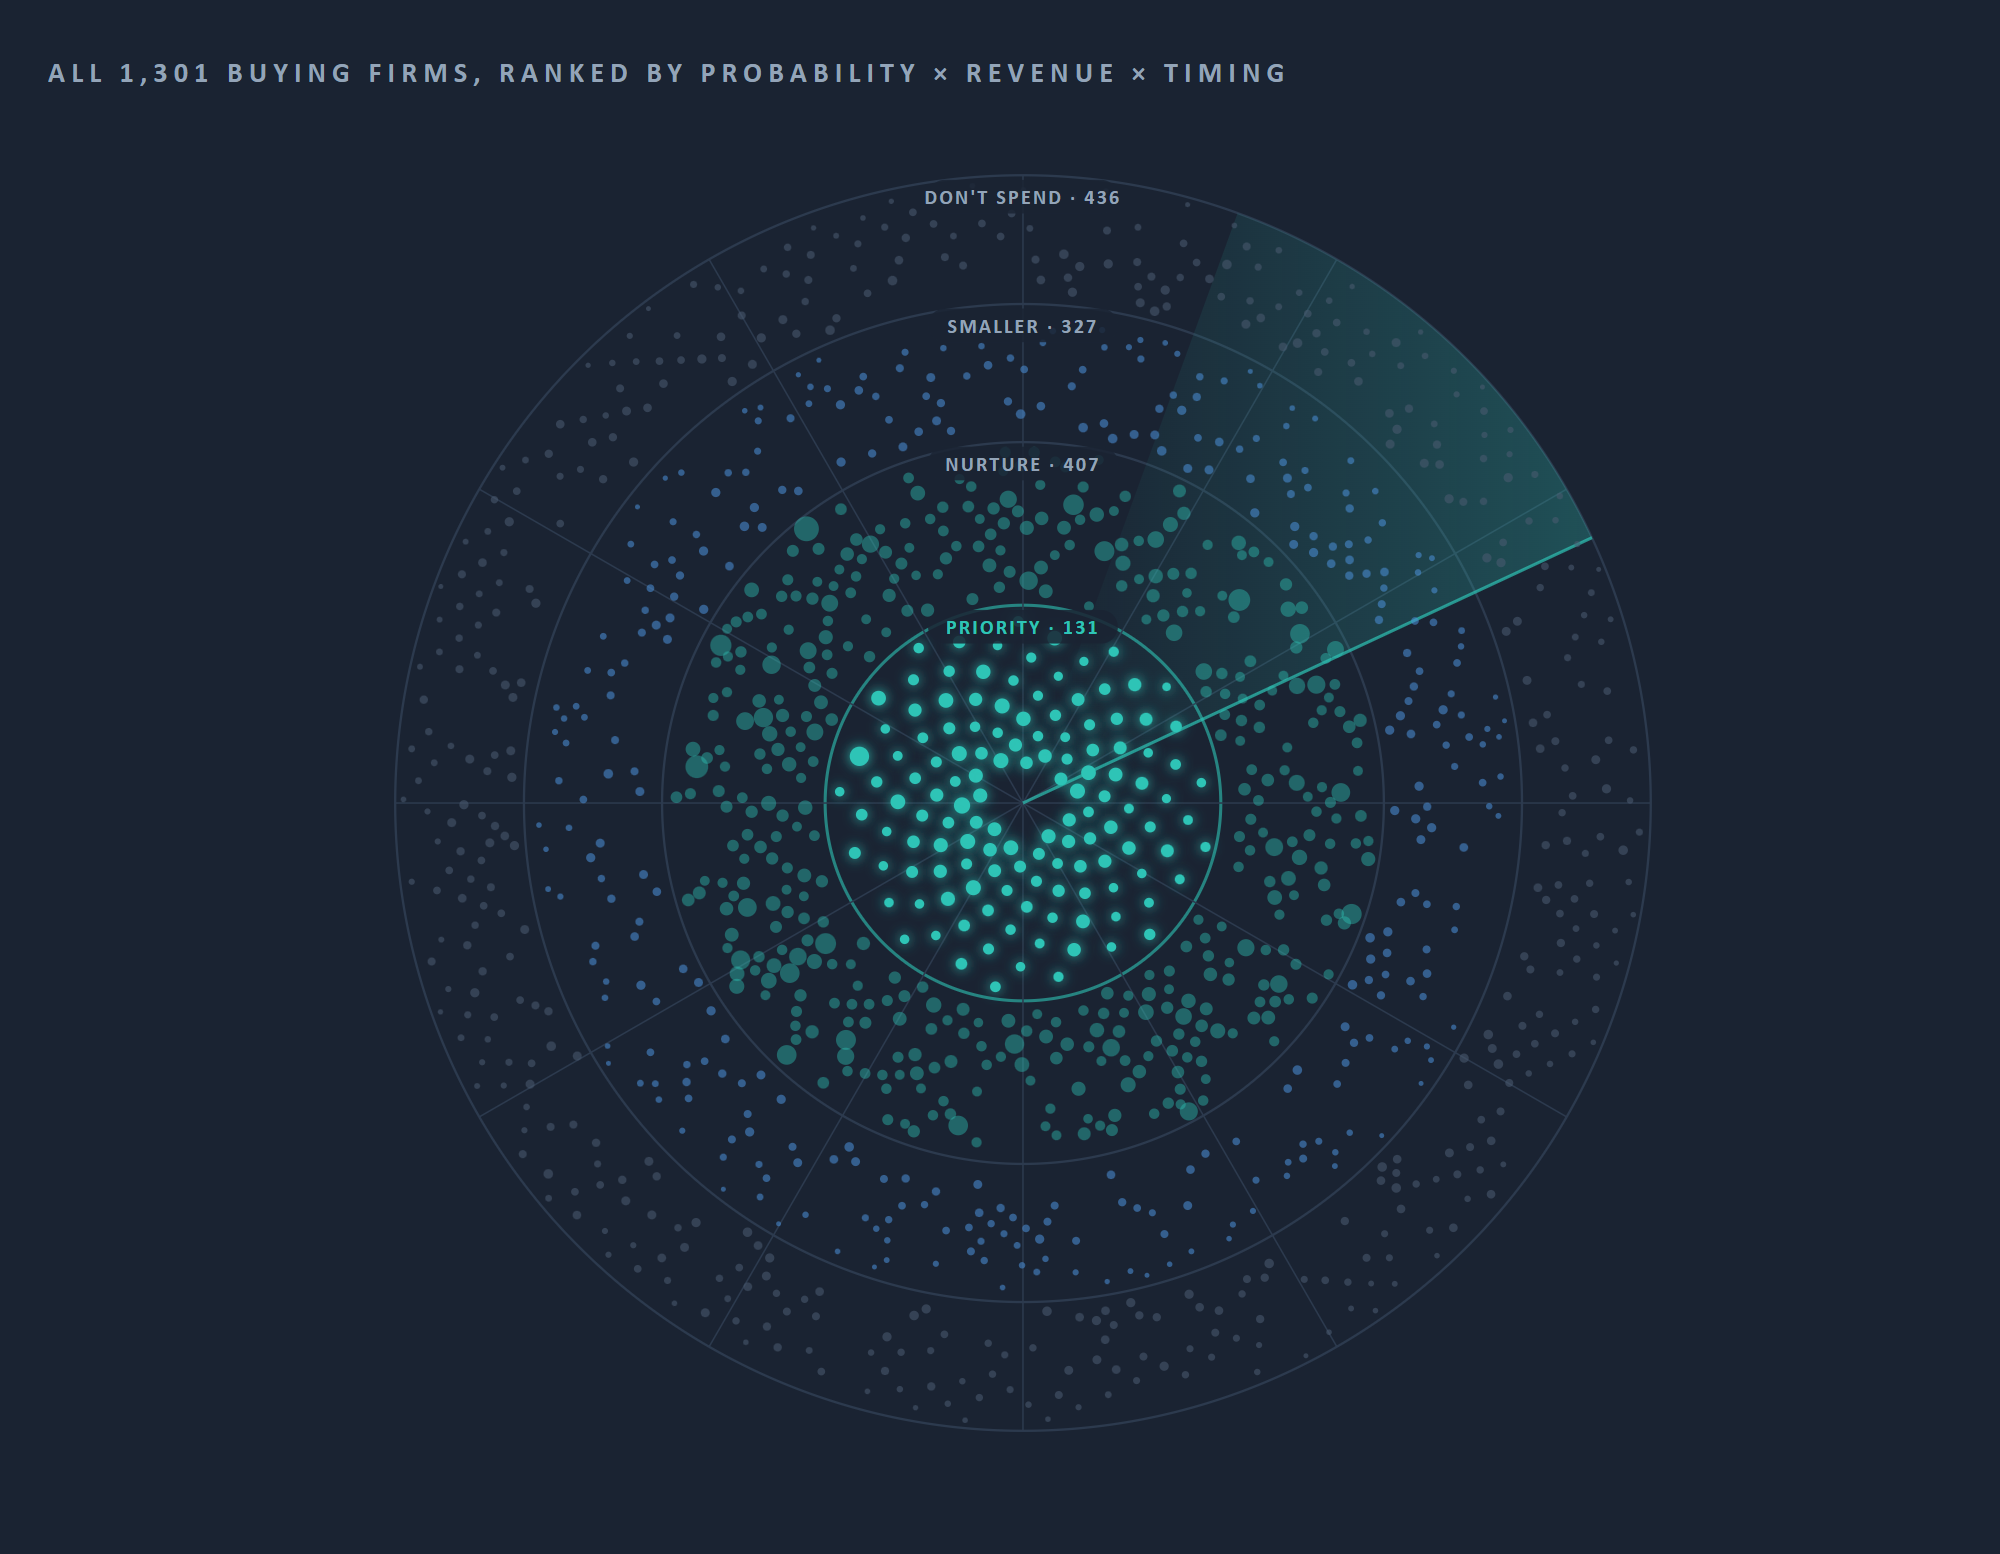
119 of 131 priority firms are new to the category or accelerating their buying. The median priority firm manages $2.5bn of client assets. 110 already use outside managers or model marketplaces. Not more names: the right names, in order.
Where the time goes
The ranking turns 1,301 names into allocation decisions, in the language every asset manager already uses. The fourth input, access, comes from your own network: who you already know, who can introduce you, and how strong each route is.
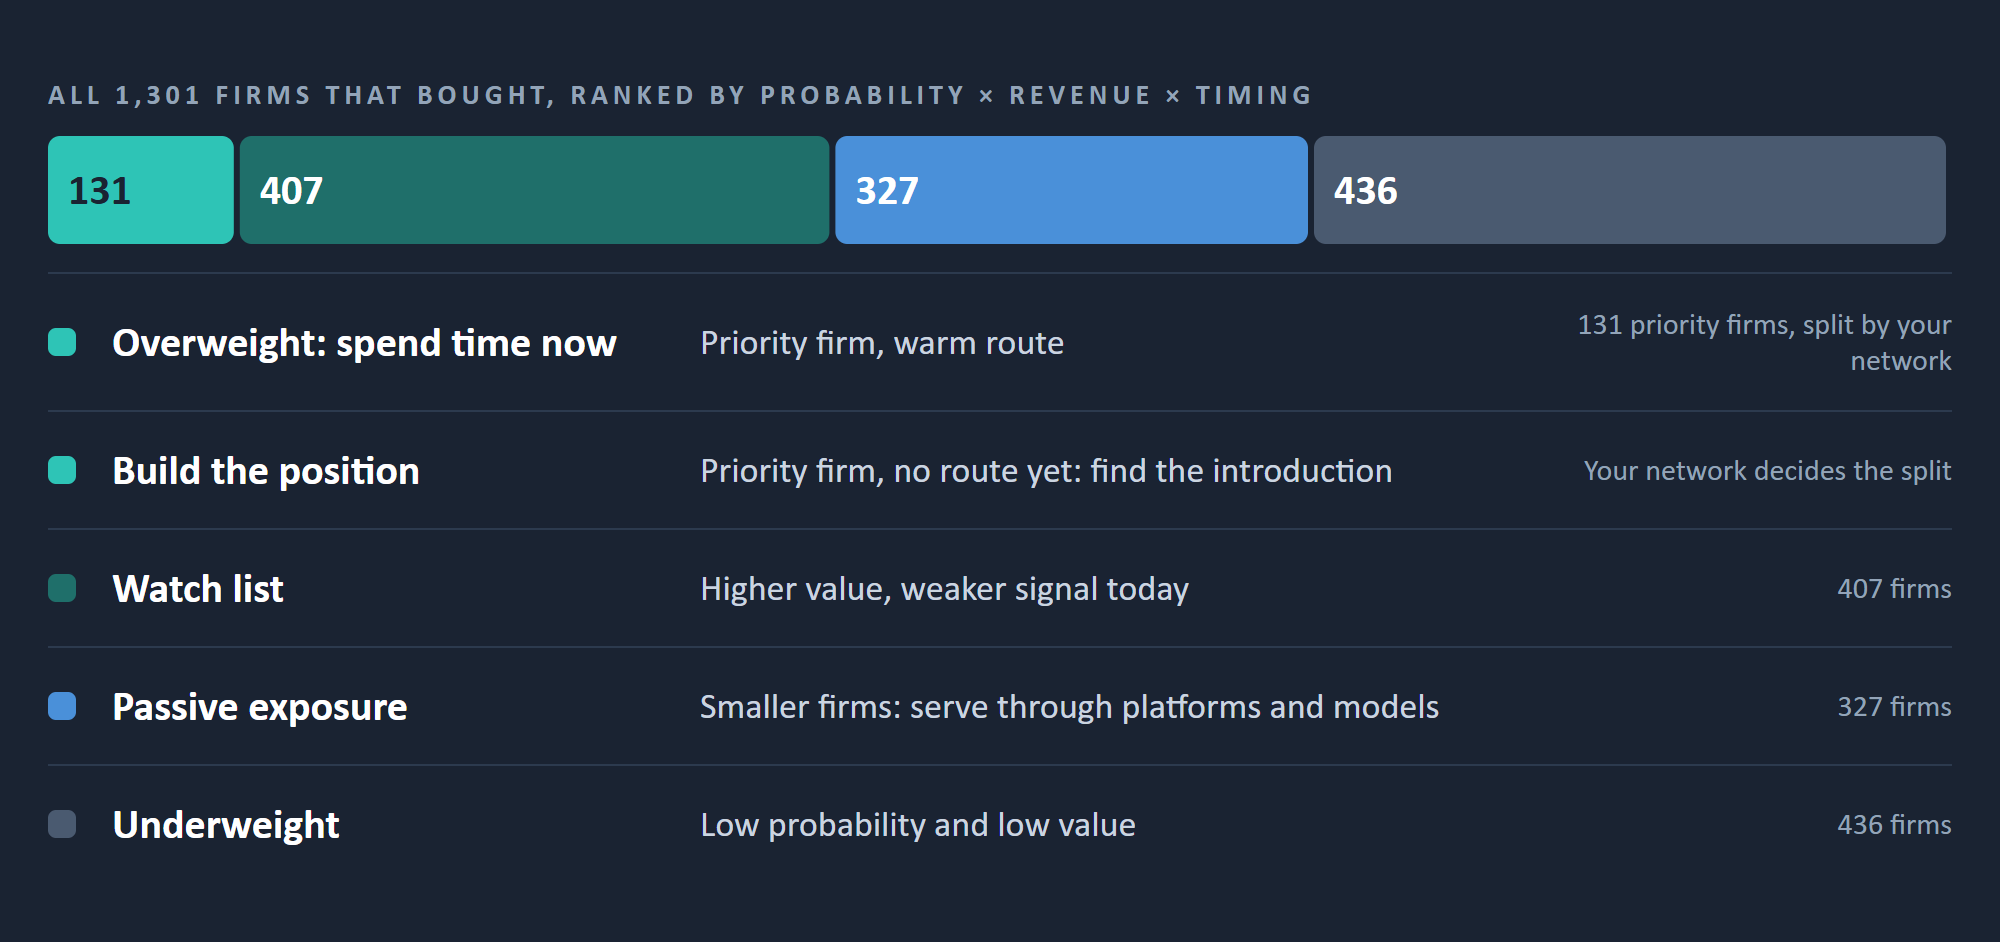
Most pipelines are an equal-weighted index: every prospect gets the same attention. Run a high-conviction portfolio of relationships instead. Overweight where probability, revenue and access meet; build positions where the opportunity is real but the route isn't yet; serve the long tail through platforms and models rather than meetings.
How do I get to them?
Two layers. The door comes from public data: how each firm makes decisions, which custodians and platforms it uses. 106 of 131 priority firms run a CIO plus a model or platform team; 91 custody with Schwab and 64 with Fidelity. Now imagine combining the ranked list with your existing network: who you already know at each priority firm, who can introduce you, and which relationship is the strongest route in.
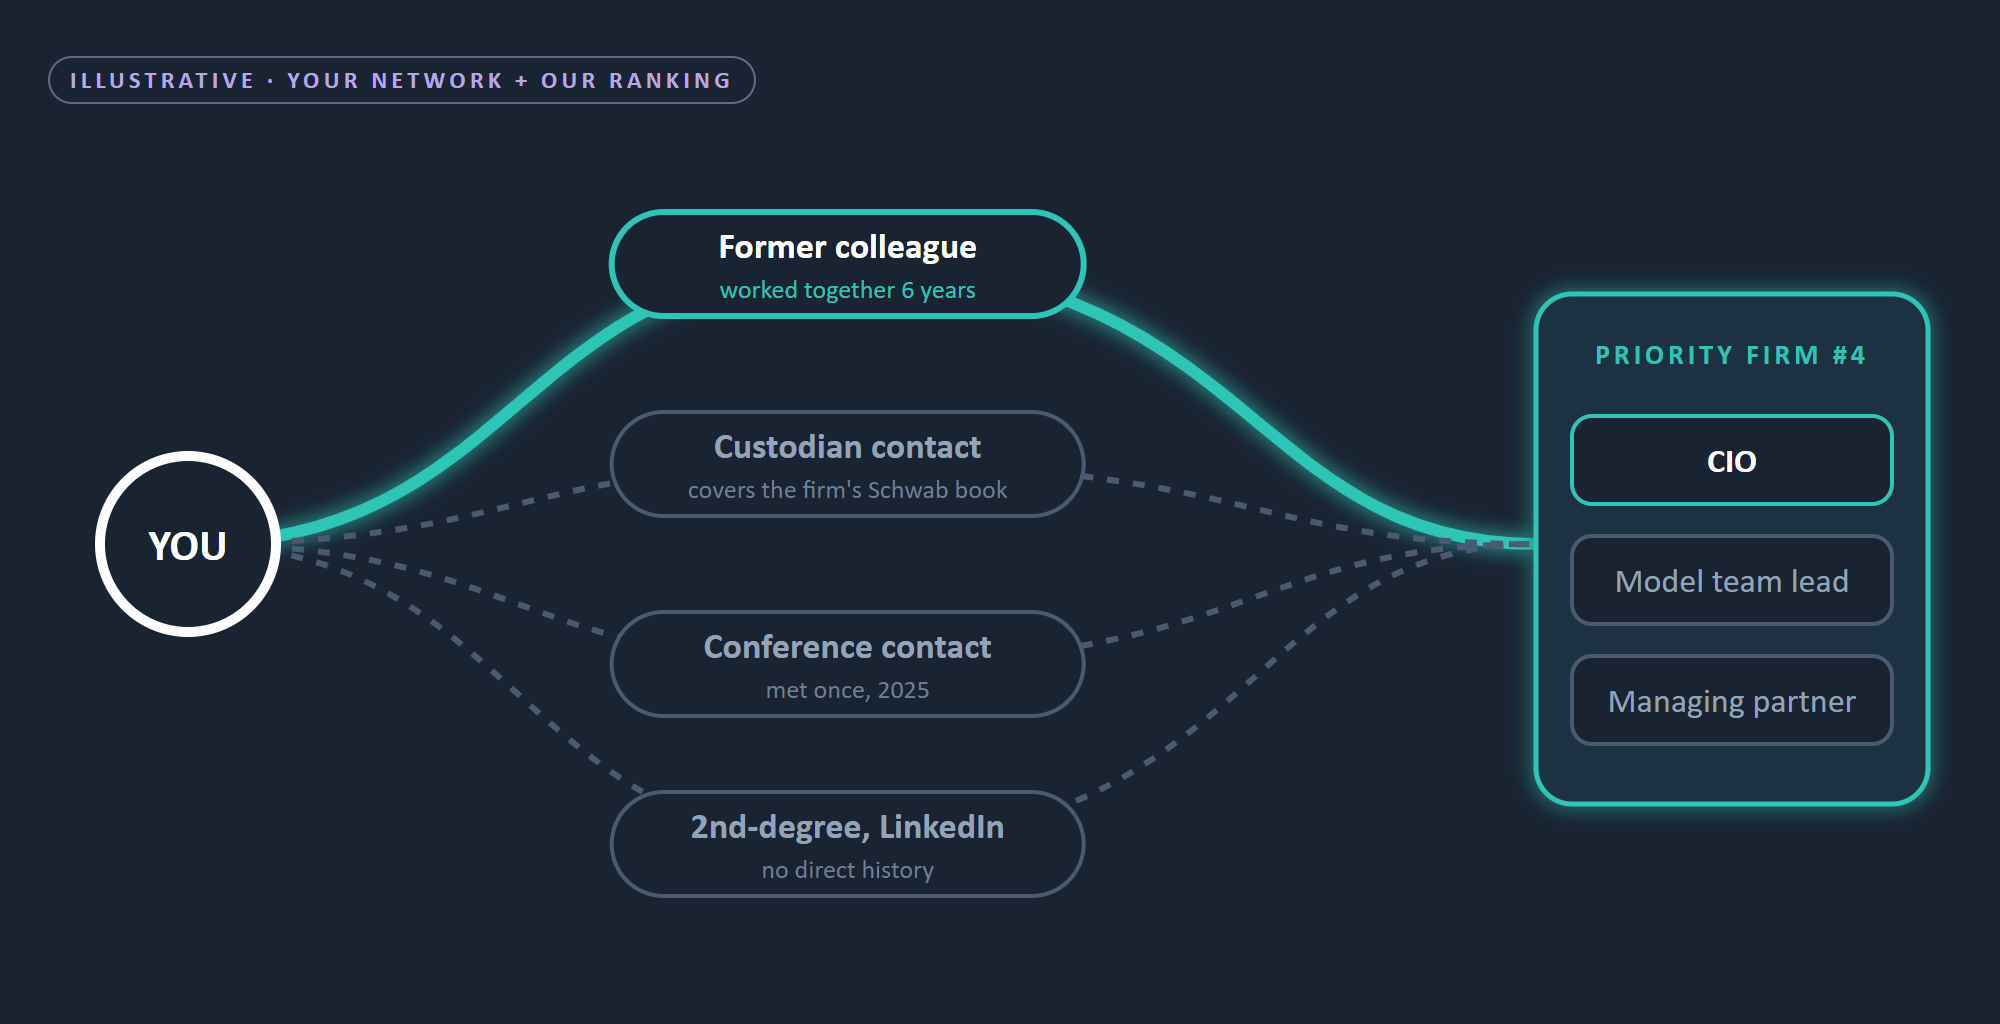
Named individuals come from your own CRM and contacts, or from public profiles. The decision model tells you which role to look for: the CIO and the model team, not the general inbox.
Walk in prepared
Once you know who to meet, sales enablement does the preparation. For priority firm #4, an accelerating US adviser of about $7.7bn, it starts with the firm's own holdings. Its option-income sleeve grew from $64m to $94m in a quarter, across 20 ETFs. 83% of it is written on US large caps, three issuers hold 63%, and none of it is international or small-cap.
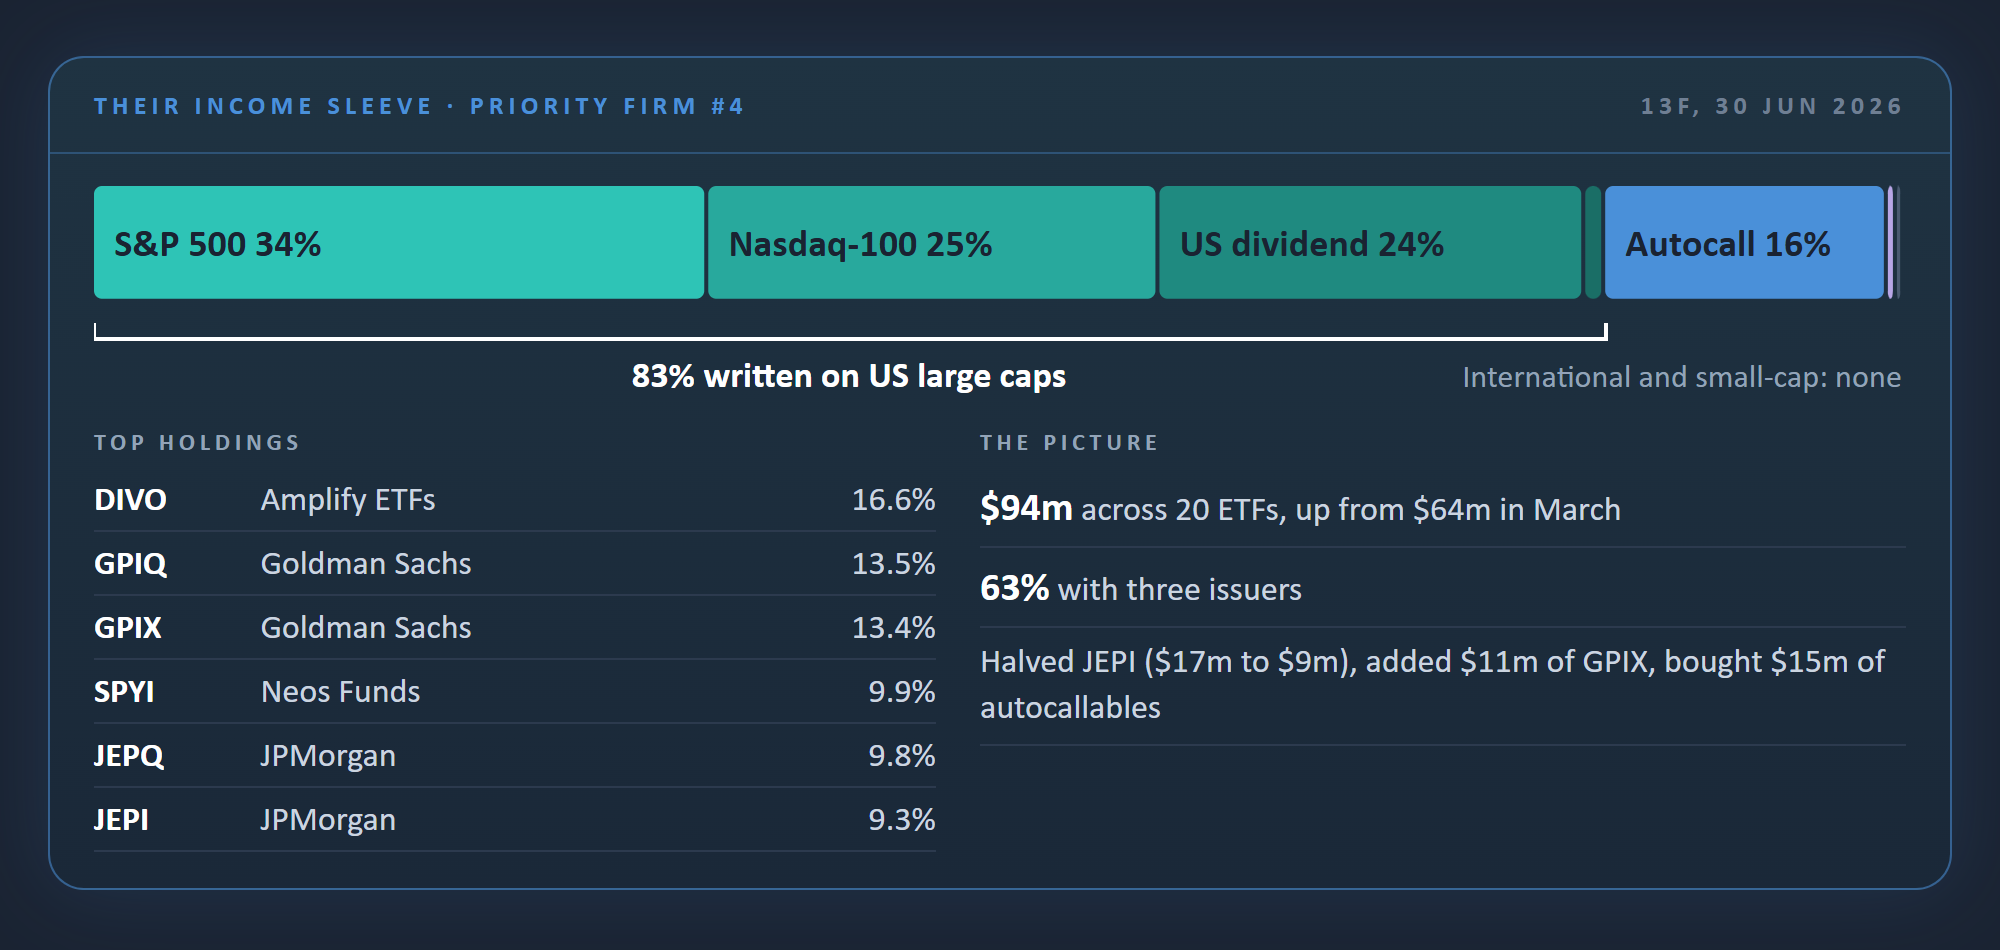
The gap is that almost all of the premium comes from one market. The position follows: a diversifier, not a replacement, with income from somewhere else.
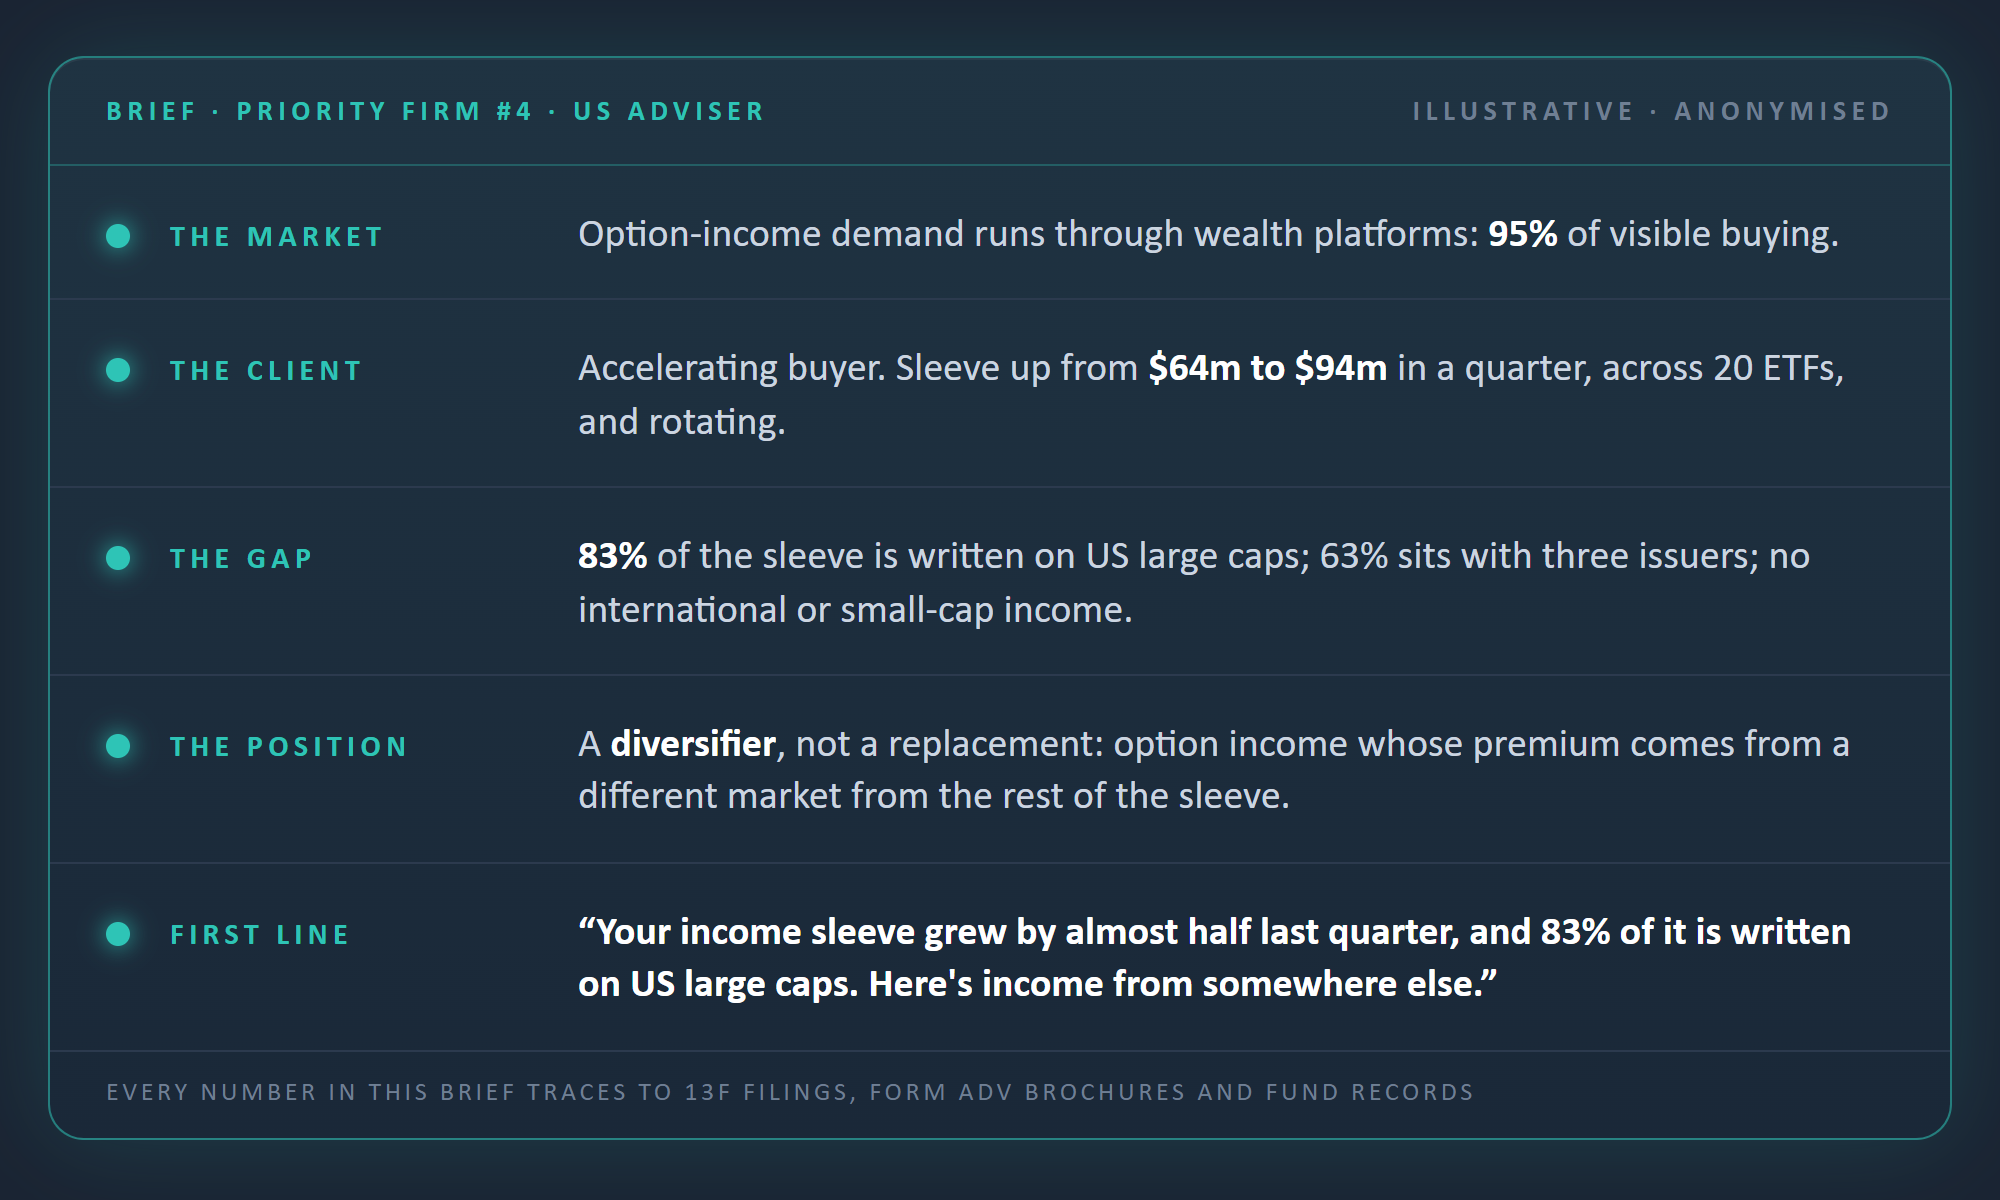
Skip the introduction. Open with their gap: "Your income sleeve grew by almost half last quarter, and 83% of it is written on US large caps. Here's income from somewhere else."
Same method, institutional channel
The same sequence works where the buyer is an institution. Institutions disclose something better than a name: their need. In fiscal 2024, 67 of 146 US public pensions held more private equity than their target, about $127bn over in total, and 84 of 160 were short of their real estate target. One city pension of about $87bn holds 13.5% in private equity against a 10% target, and its 2015 to 2018 funds have paid back a median 0.70x of the capital invested.
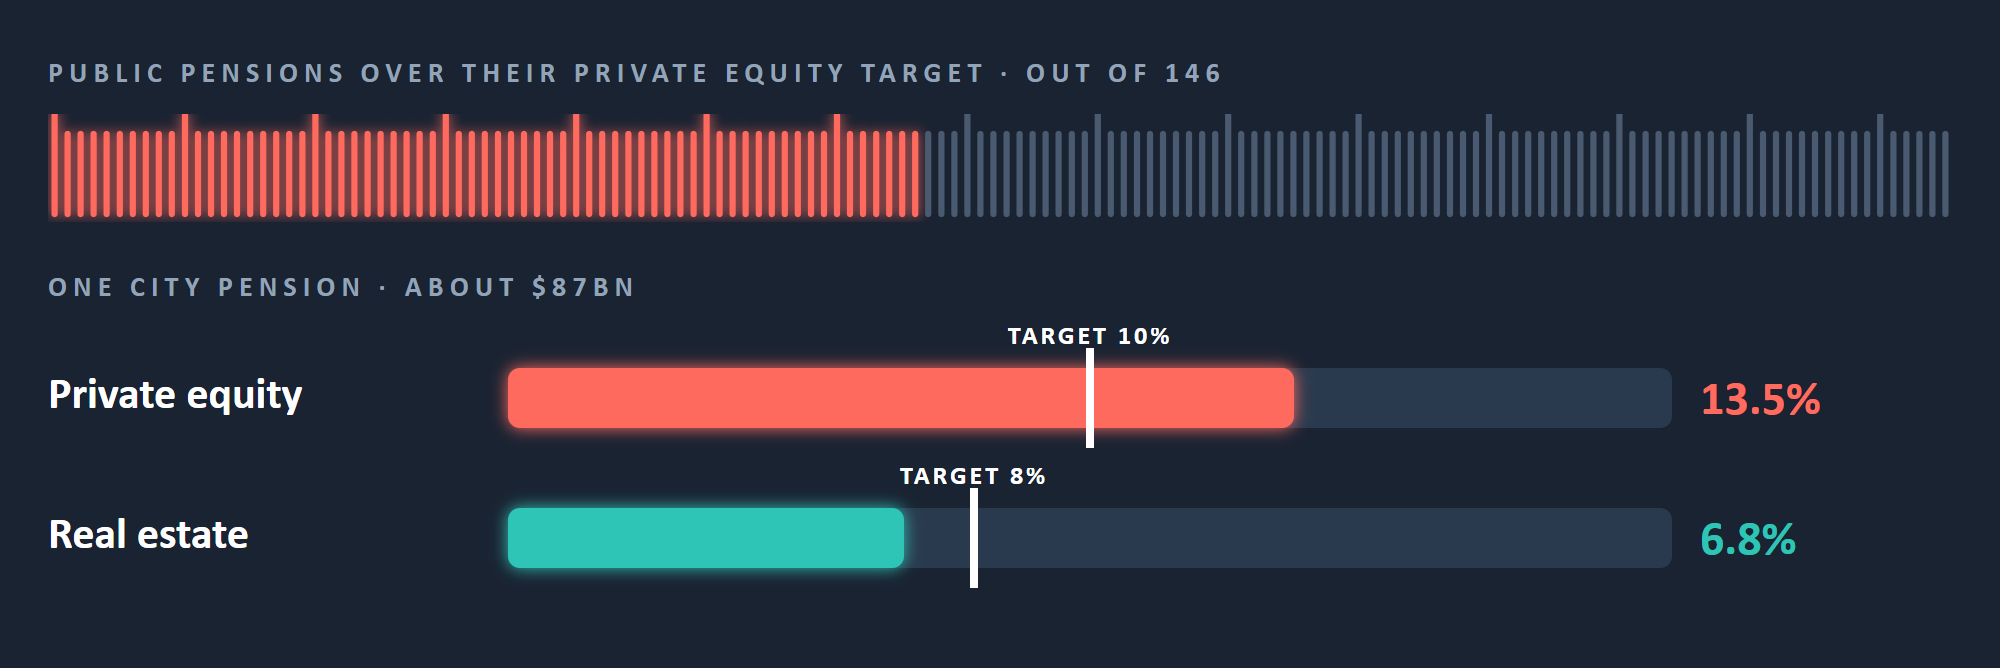
Over target and waiting on cash, that plan doesn't need another buyout fund. It needs liquidity, income or real assets. The need decides the pitch: replace the incumbent, or sit beside them.
What it adds up to
The real value is in the first four steps: seeing where demand is forming, ranking who has it by probability, revenue and timing, and finding the route in. The objective isn't more meetings. It's better meetings with the right investors. Productivity follows, and it is supporting evidence rather than the point.
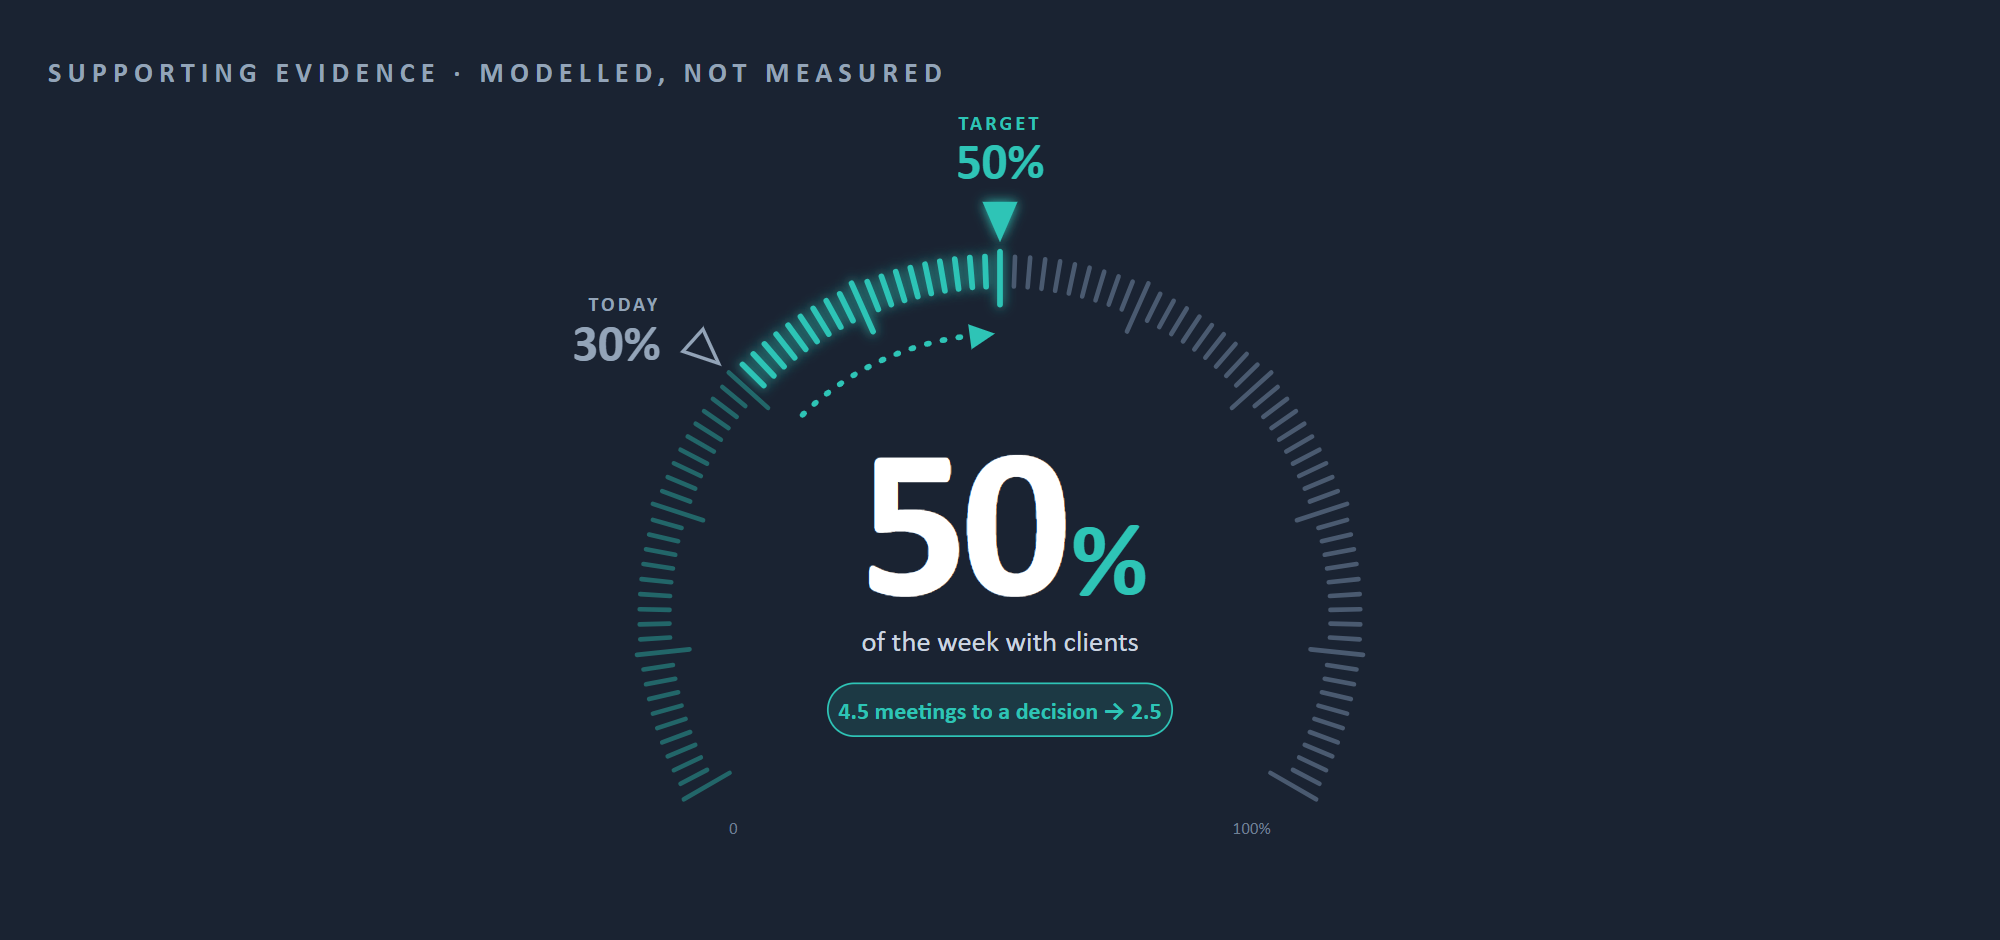
Published surveys put a salesperson's selling time at 25% to 40% (Bain 2025; Salesforce 2022, 2026), and 40% to 60% of deals end in no decision (Dixon and McKenna, 2022). The best B2B teams spend a third to half of their time with customers (McKinsey, 2025). In our model, moving from 30% of the week with clients and 4.5 meetings to a decision, to 50% and 2.5 meetings, lets one salesperson drive 3.0x the decisions; halfway gives 1.7x. This is modelled, not measured.
What you get
Your ranked list of buying firms, refreshed quarterly with each 13F filing cycle.
The door and route for each priority firm.
A pre-meeting brief for each priority firm, every figure sourced.
How to start: a pilot on one product. We rank the buyers of one of your funds and brief your top ten.
Practitioners, not consultants. We built a disciplined, systematic way to run a high-conviction portfolio of relationships. Relationships are scarce. Intelligence tells you where to invest them.
Sources and method
Demand and buyers. US ETF net flows by Morningstar category, October 2025 to September 2026. SEC Form 13F holdings at 31 December 2025, 31 March and 30 June 2026; net buying is the change in shares at quarter-end prices; channels classified from filer names.
Ranking. 1,301 independent advisory firms that net bought in Q2 2026. Score = probability × revenue × timing. Probability: 60% size of the Q2 add relative to the firm's 13F book, 20% breadth across option-income ETFs, 20% use of outside managers or model marketplaces. Revenue: firm regulatory assets (Form ADV 2026). Timing: new to the category 1.00, accelerating 0.90, steady 0.70, slowing 0.45. Priority is the top 10% of the score: 131 firms (score at or above 0.406). Decision model and custodians from Form ADV brochures.
Access and people. Named individuals and relationship routes come from the client's own contacts and CRM; the routes shown are illustrative.
Pensions. US state and local public pension annual reports, fiscal 2024, the latest available; one plan's published private fund reports to December 2025, plan anonymised.
External research. Bain & Company, Technology Report 2025. Salesforce, State of Sales (2022, 2026). McKinsey & Company (2025). Boston Consulting Group, Global Asset Management Report 2026. Gartner (2020, 2021, 2025). Forrester, State of Business Buying 2024. Dixon and McKenna, The JOLT Effect (2022). Coalition Greenwich (2025).
Important information
Important information. Three Horizons Capital is a technology and data architecture company, not a registered investment adviser. This paper is for information only and is not investment advice. Allocators and firms named in the analysis are anonymised. The time model is a 3HC assumption, not a measurement.