Fixed income
Half of This Trade Is Built to Last
As policy expectations turned hawkish this summer, money moved through the bond market. It did not move the way the story is usually told, and only one of its two legs is the kind an allocator can hold.
Three Horizons Capital | 3 September 2026 | US dollars | Money-flow figures cover US-domiciled bond funds, February to July 2026 | Weekly and news measures run to late August 2026 | For professional investors | No fund, manager, issuer or individual is named
+$138bn
into medium-dated bond funds over six months, against +$120bn into short-dated. The money did not leave duration
91% v 19%
how much of the movement in corporate debt tracks the news, against how much of the movement in government debt does
7 days
for the strongest weekly reading of the summer in government debt to fall back below average
Every allocator has now read that money rotated into short-dated bonds and out of credit as the interest-rate outlook hardened. Most of that is true. The part that is not true is the part most often repeated, and the part nobody mentions is the one that decides whether the trade is worth putting on.
This note does three things. It shows what actually moved, using money into and out of bond funds rather than movements in yields, because a yield can move on opinion while a flow requires somebody to act. It separates the half of the move that is chasing headlines from the half that is not. And it sets out what follows for a portfolio, in three questions that can be answered in an afternoon.
The finding in one line
The bond bid broadened rather than shortened, and the exit from riskier credit is news-driven and reversible while the move into government debt is not. Those two legs deserve very different holding periods, and most commentary treats them as one trade.
We are not the only ones whose attention has landed on the long end of the curve. Writing and broadcasting in late August, the economist and author David McWilliams arrived at the same place from an entirely different direction, arguing on his podcast that the strain in the American bond market sits at the long end and that the pressure there is structural rather than passing. He gets there through public finances and the supply of new debt. We get there by following where the money actually went. Two methods, one answer. Where his argument is useful to ours, later in this note, we say so and credit it.
The money did not leave duration
Duration is simply how long you are lending for. A short-dated bond fund lends for roughly one to three years, a medium-dated one for about five to ten, and a long-dated one for twenty or more. When rates are expected to rise, the textbook move is to shorten, because longer loans lose more value when rates go up.
That is the story told about this summer, and the evidence usually offered is a comparison between short-dated funds and long-dated ones. Set those two side by side and the conclusion looks obvious. It also leaves out the middle of the curve, which is where most bond money actually sits.
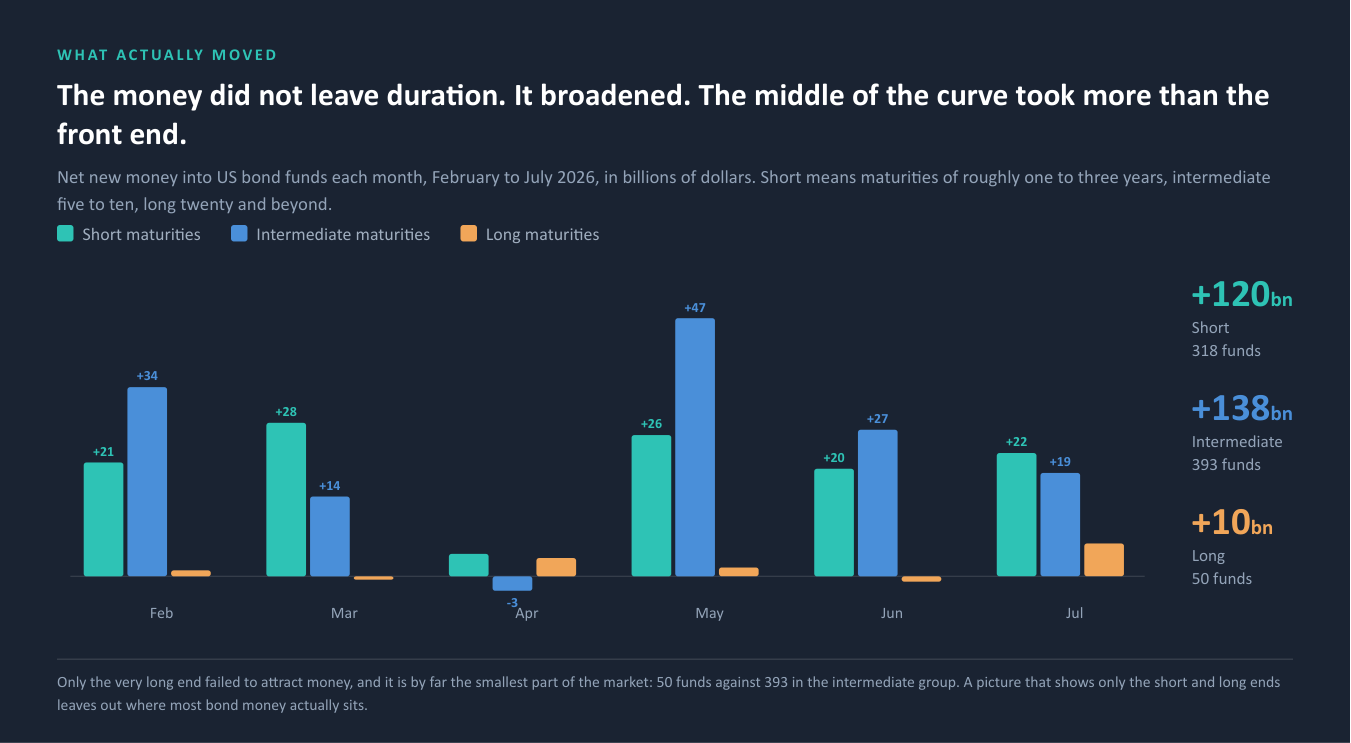
Over the six months, short-dated funds took +$120bn across 318 funds. Medium-dated funds took +$138bn across 393. Long-dated funds took +$10bn across 50.
So the middle of the curve took more money than the front end, and it is the largest of the three by a wide margin. The only part of the market that genuinely failed to attract money is the very long end, which is fifty funds and about $10bn over half a year.
Why the very long end alone should go begging is not a question our data can answer. It measures where money went, not why. One hypothesis worth naming comes from David McWilliams, who argues that the sums American technology companies are now borrowing to build artificial-intelligence capacity have grown large enough to compete with governments for the same pool of long-dated money, and are crowding it out. We have not tested that and it is his argument rather than our finding. It is consistent with what we observe, and it is the most concrete explanation we have heard for a gap this specific.
What the data supports, stated precisely
Not a flight out of duration. A broad bid for bonds, strongest at the front, absent only at the very long end. That is a different position and it implies a different portfolio. Shortening a whole fixed-income book on the first version of the story would have meant selling the part of the market that was quietly taking the most money.
Where money did leave
The move away from risk is real, but it happened on a different axis. Not by how long you lend, but by who you lend to.
Corporate debt splits into two broad tiers. Investment grade is debt from companies rated as more likely to repay, so it pays less. High yield is debt from companies rated as less likely to repay, so it pays more and falls harder when confidence goes.
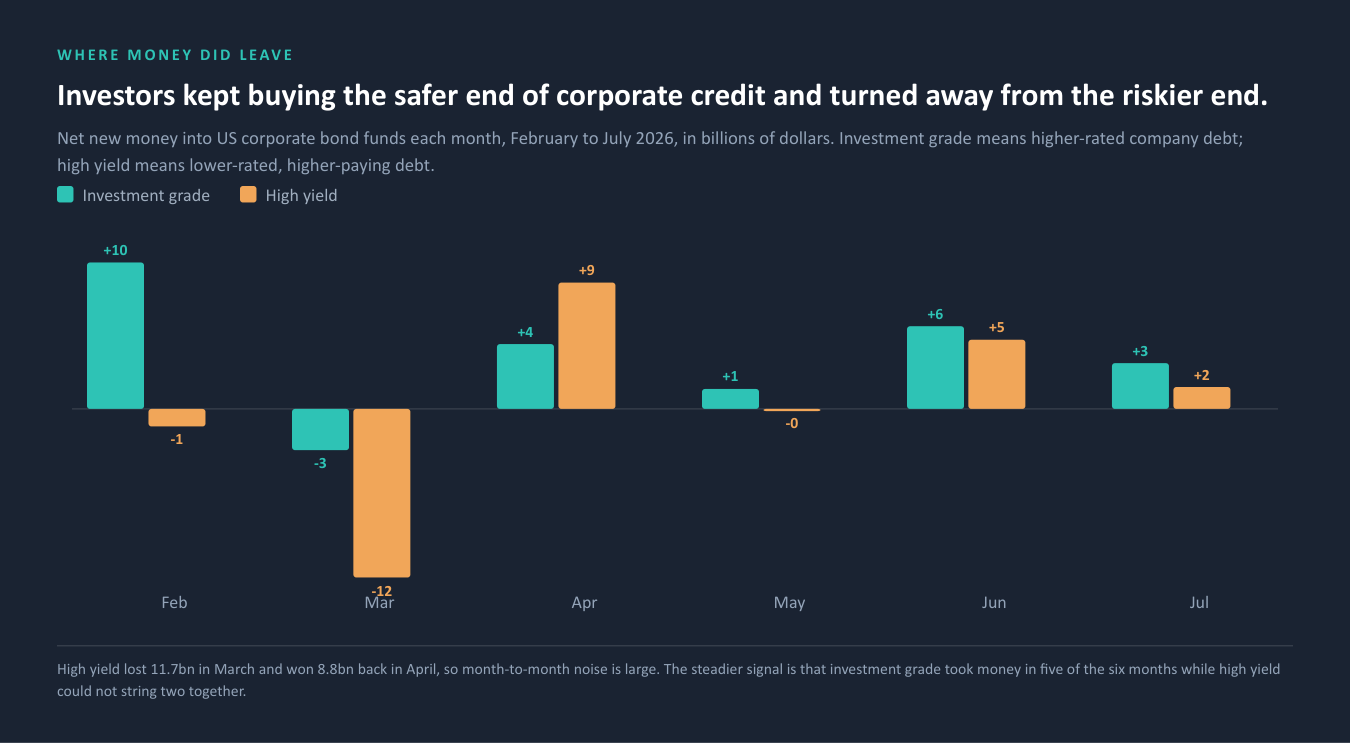
Higher-rated corporate funds took money in five of the six months. Lower-rated funds could not string two positive months together, and the swings are violent: minus $11.7bn in March, then plus $8.8bn in April as much of the same money came back.
That volatility is itself the point. Money that leaves in one month and returns the next is not repositioning. It is reacting. Which raises the question this note is really about: when a flow moves, how do you tell whether it is a decision or a reflex?
The two halves of the trade
There is a way to test it. Take each group's month-to-month movement and ask how much of it lines up with what the news is discussing at the time. Whatever is left over is money moving for reasons that have nothing to do with headlines: cash arriving, liabilities being matched, a scheme rebalancing on its own calendar.
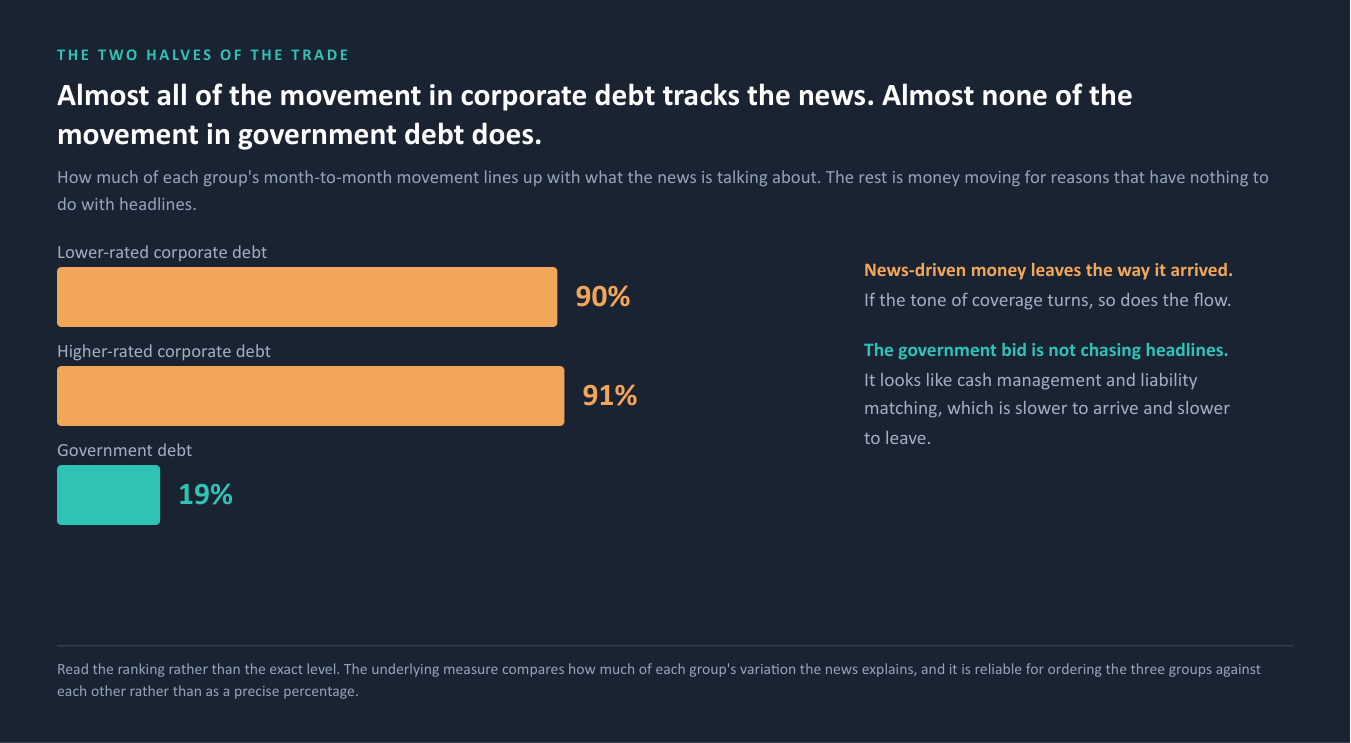
The answers are not close together. Around nine tenths of the movement in corporate debt, at both quality tiers, tracks the news. Under a fifth of the movement in government debt does.
That single contrast is the most useful thing in this note, because it tells you what each leg is made of. The credit move is a sentiment position. It arrived on a story and it will leave on one. The government move is not. It looks like the slow, unglamorous business of matching cash to obligations, which starts for its own reasons and stops for its own reasons.
Why this matters more than the direction
Both legs pointed the same way this summer, so they were easy to read as one trade. They are not one trade. One has a shelf life measured in weeks and the other does not, and that difference should drive position size and holding period far more than the direction does.
What the coverage was actually doing
If the credit leg is news-driven, it is worth looking at the news directly rather than assuming. We measure the tone of coverage mentioning the central bank: how positive or negative the language is, day by day, where zero would be neutral.
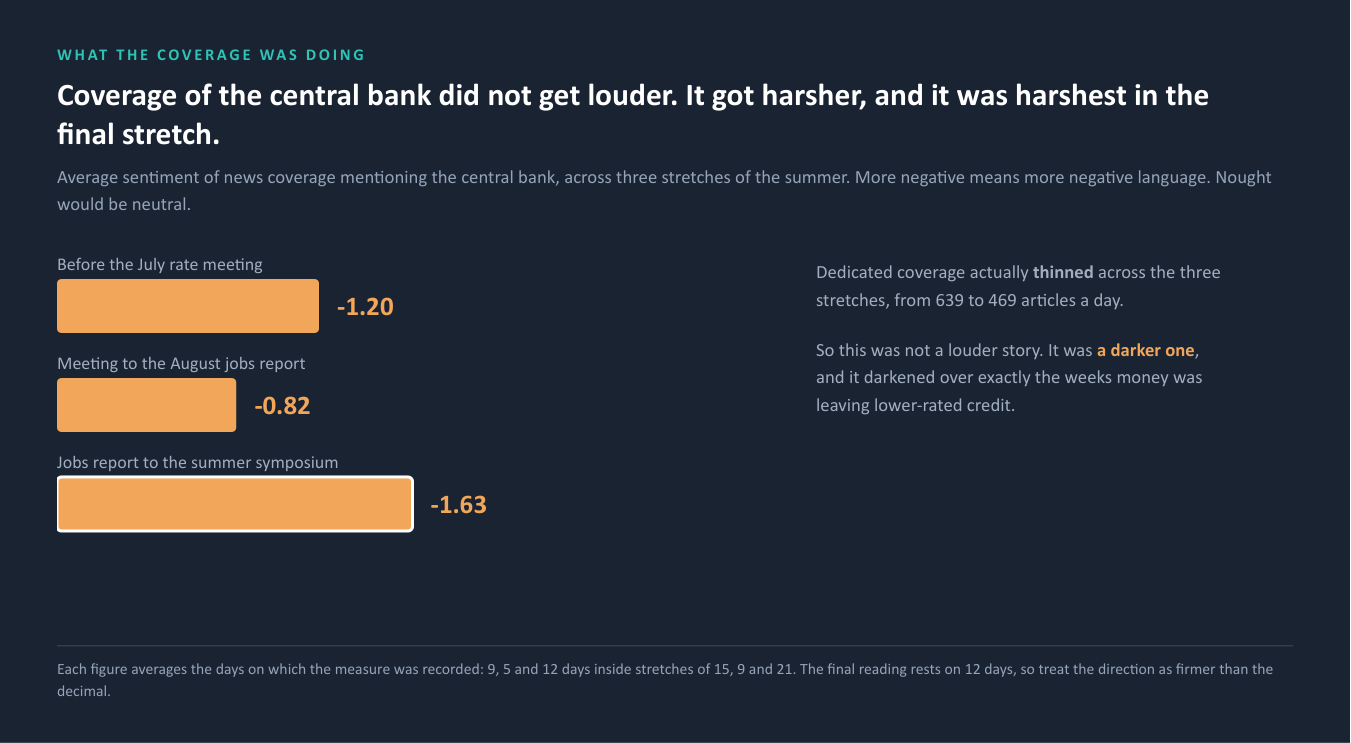
Two things stand out. Coverage got steadily more negative, reaching its harshest reading of the summer in the final stretch. And the volume of dedicated coverage fell across the same three stretches, from 639 to 469 articles a day.
So this was not a story getting louder. It was a story getting darker while getting quieter, and it darkened over precisely the weeks money was leaving lower-rated credit. That is a closer fit than a simple count of headlines would have given, and it is the sort of thing a count of headlines would have missed entirely.
A caution we would rather state than bury
These are averages of the days on which the measure was recorded, and it is not recorded every day. The final reading rests on 12 days inside a stretch of 21. Trust the direction more than the decimal.
How long a reading actually lasts
The last question is the one that decides whether any of this is tradeable: how long does a reading stay true?
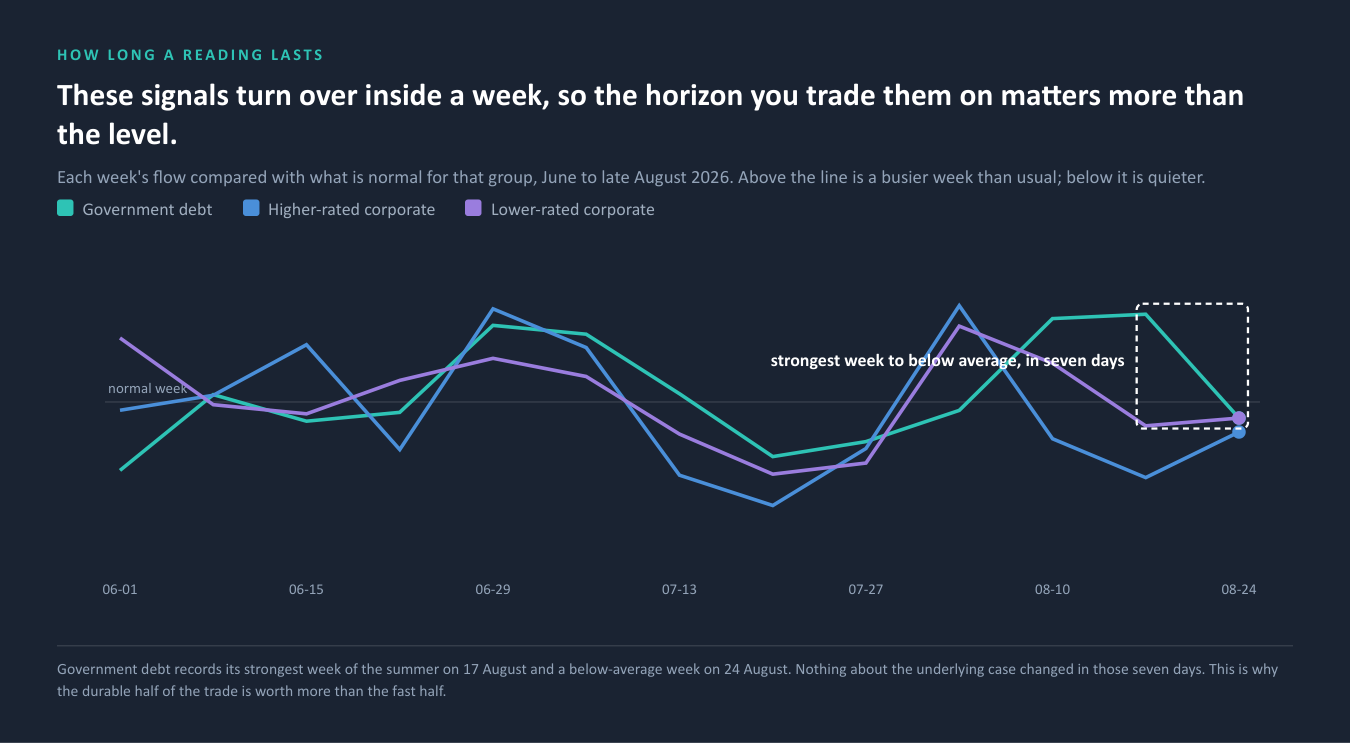
Government debt records its strongest week of the summer on 17 August and a below-average week seven days later. Nothing about the underlying case changed in between. On a longer view the same series still reads as gathering pace, and both readings are correct. They are simply measuring different lengths of time.
The economic readings underneath the story behave the same way. One widely used measure of how the labour market is doing, published at the end of August and pointing to a cooling job market, was updated three days later on the same month's data. The new reading was nearly three times the first and it pointed the other way. Nobody erred. That is what these measures do as information arrives.
The same pattern appears on the policy side of the market. David McWilliams reports that when the US Treasury announced it would double its buying back of long-dated debt, an intervention aimed squarely at the part of the curve nobody wants, it bought roughly two days of lower yields before they returned to where they had started. That is his account and not our measurement, and we have not tested it. But a two-day effect from a deliberate policy action is the same phenomenon we measure in flows, reached from the opposite end: the reading turns over faster than any position built on it.
The practical consequence
A signal that inverts inside a week cannot carry a position held for a quarter. This is not an argument against using flow data, which is better evidence than yields precisely because somebody had to act to create it. It is an argument for matching the holding period to the shelf life, and for writing the date next to every number you rely on.
What an allocator does about it
Three questions. None needs a new mandate, a new manager or a new system, and all three can be answered against a book you already hold.
Is your bond book short, or is it just not long?
These are different positions and they get confused constantly. If you shortened this summer on the view that money was leaving duration, check what you sold. The medium-dated part of the market took more money than the front end over the same six months. Shortening into that is a decision worth making deliberately rather than by default.
Which of your positions is a sentiment position?
Ask of each one whether it would still make sense if coverage turned. Roughly nine tenths of the movement in corporate debt tracks the news, so a credit underweight put on this summer has a short natural life and should be sized and reviewed as one. The government leg is not, and can be held on a longer horizon.
What date is on the number you are acting on?
Not the date you read it, the date it was measured. Weekly flow readings here turn over inside a week and economic readings get revised within days. A number without a date attached is not a fact anyone can audit, and in our experience it is the most common weakness in an investment case that later looks unlucky rather than wrong.
What this looks like in practice is less dramatic than a reallocation. It is mostly a change to how two existing positions are governed. The government leg gets a normal review cycle, because nothing about it is time-critical. The credit leg gets a shorter one and an explicit trigger, because the thing that would invalidate it, a turn in coverage, is observable and moves faster than a quarterly meeting.
The shortest version
Own the government leg on a long horizon. Treat the credit leg as a trade with a half-life. And do not shorten the whole book on a story about duration that the money itself does not support.
What we measured, and what we did not
What the money figures cover.
Net new money into and out of US-domiciled bond funds, monthly, February to July 2026. Where a fund offers several share classes we count the fund once, not once per class, which is a common way of double-counting these figures.
What the weekly and news figures cover.
Weekly flow readings and news measures run to late August 2026. They therefore capture the run-up to the summer's set-piece policy event, not the reaction to it. We would rather say that plainly than imply a timeliness we do not have.
How the news measure works, and its limits.
It compares each group's movement with what coverage was discussing at the time. It is reliable for ranking the three groups against one another, which is how we use it, and it is not precise enough to defend a decimal place, which is why we quote it as roughly nine tenths and under a fifth. The tone averages rest on 9, 5 and 12 recorded days, and the coverage measured is worldwide rather than US only.
What we did not do.
We have not offered a view on where interest rates go next, and nothing here rests on what any policy meeting decided or on how markets priced it afterwards. Those are matters of public record and outside what we measure. The policy backdrop appears in this note only through something we observe directly, which is the tone of coverage.
Outside voices.
The two arguments credited to David McWilliams come from his podcast in late August 2026. They are his, not ours, we have not tested either against our own data, and citing him does not imply he endorses anything else in this note. His conclusions about where policy goes next are his own and are more directional than ours.
Where this could be wrong.
Six months is a short window and one summer is one episode. The relationship between news and credit flow is strong now and has not been tested here across a full cycle. If coverage turns positive and credit flow does not follow, the central claim in section three weakens, and that is the test we would apply to it next.
If this is useful
Send us one line describing a fixed-income position you currently hold. We will come back with a single page: how much of the money moving in that part of the market is tracking the news and how much is not, how quickly the readings behind it turn over, and what date sits on each number. It takes an afternoon and needs nothing from your book beyond that one line.
Important information
Publisher and purpose.
This material is published by Three Horizons Capital for general information and education. It reflects our views as at the date of publication, which are subject to change without notice, and we are under no obligation to update it.
Not advice, not a recommendation, not an offer.
Nothing here constitutes, or should be construed as, investment, legal, tax or accounting advice, a research recommendation, or an offer or solicitation to buy or sell anything. It is not a personal recommendation and takes no account of any person's objectives, financial situation, knowledge, experience or needs. Three Horizons Capital is not a regulated entity.
No fund, manager, issuer or security is named.
By editorial decision, no individual fund, manager, issuer or listed security is identified anywhere in this material. Every finding holds without the names.
Scope and basis of our own figures.
Figures derive from the Three Horizons Capital data platform and were fixed to a single derivation on 3 September 2026, from which the charts and the text both read. Money-flow figures cover US-domiciled bond funds, February to July 2026, in US dollars. Weekly and news measures run to late August 2026.
Past flows are not a guide to future flows.
The window studied is six months and covers one episode. A different window would produce different figures, and the behaviour described here may not persist.