Portfolio analytics
The AI Trade Didn't Fade. It Split.
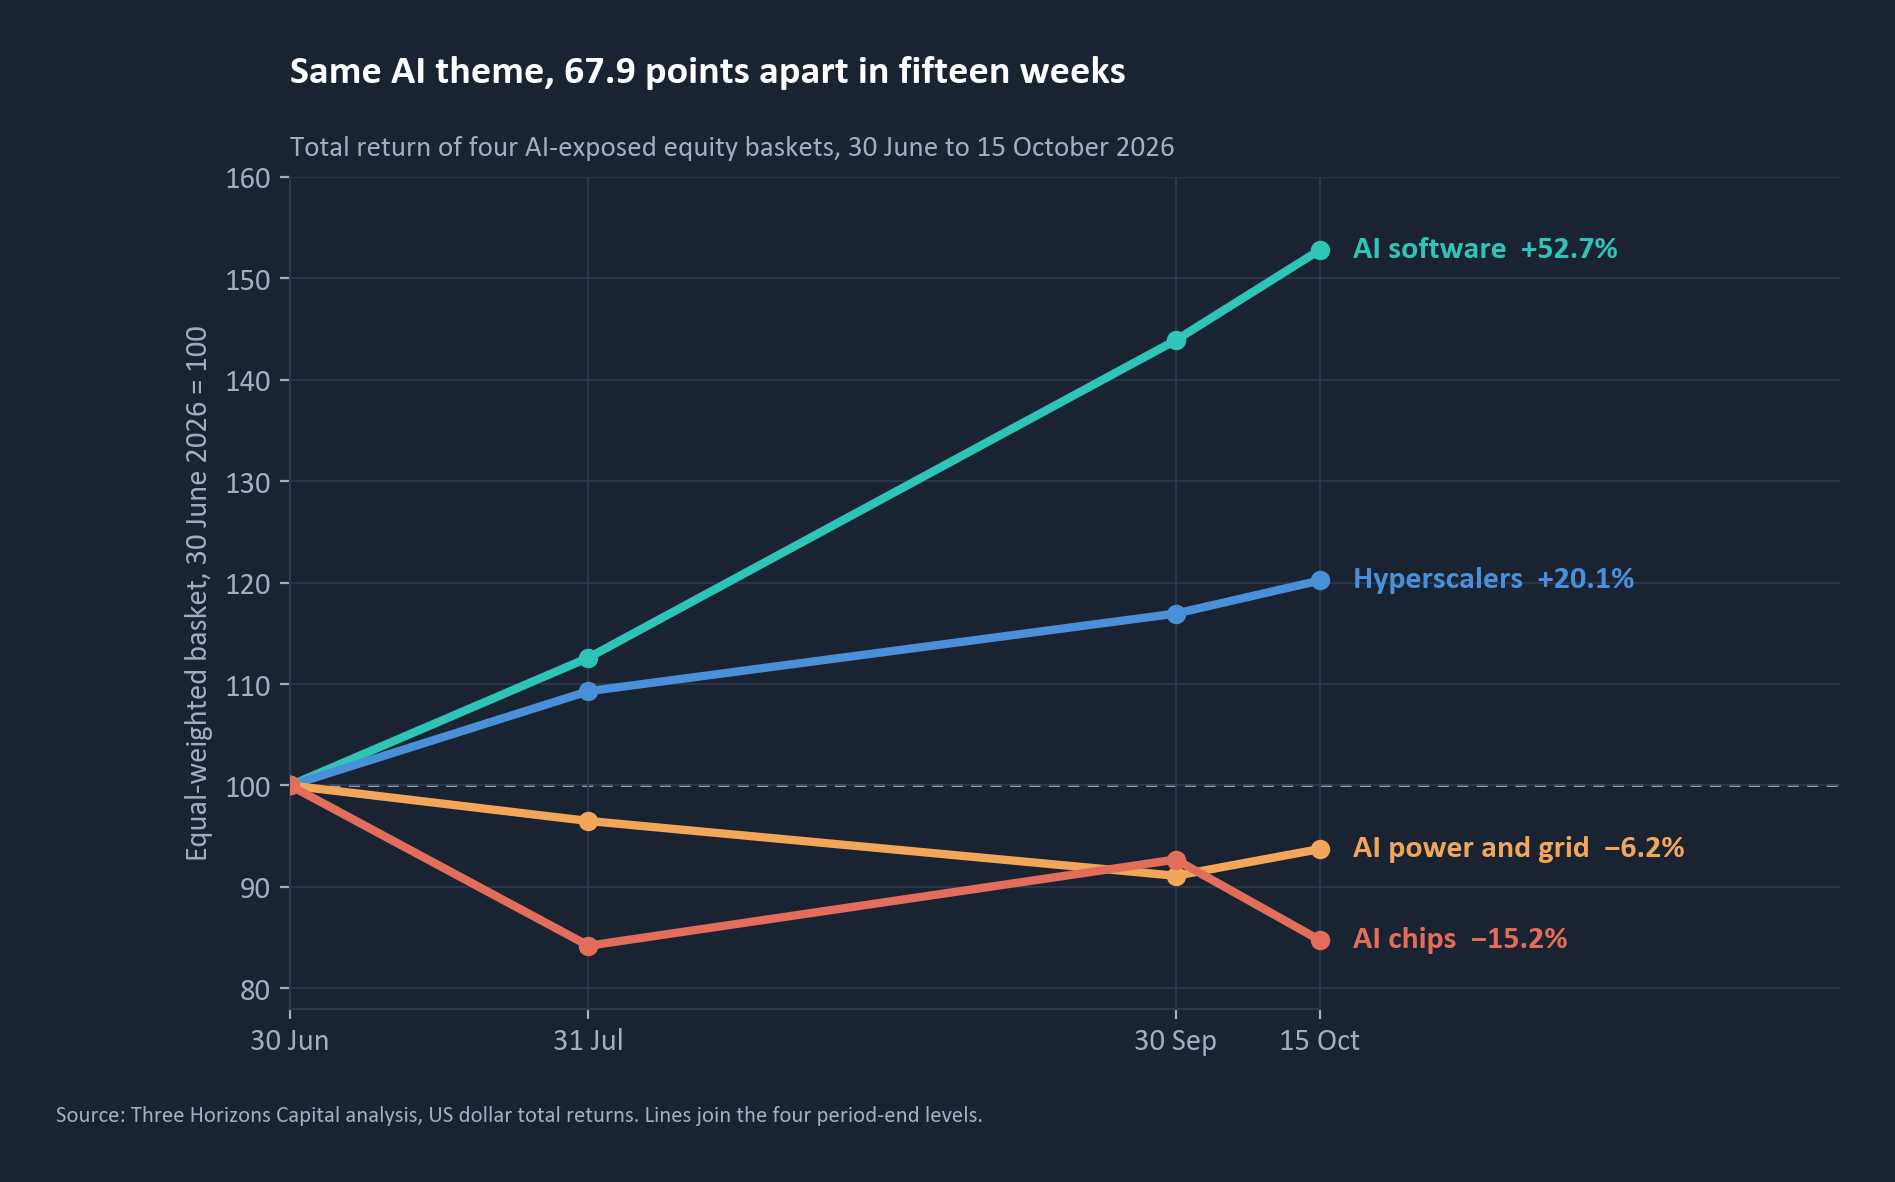
Software rose 52.7% while chips fell 15.2%, inside the same AI theme, in the same fifteen weeks. Holding all of it paid, and the bond market started charging the hyperscalers more.
Three Horizons Capital, Portfolio Analytics. Equity and bond data to 15 October 2026; investment-grade index to 14 October 2026; growth nowcast to 30 June 2026. US dollars.
+52.7% and −15.2%
AI software and AI chips over the same fifteen weeks, 30 June to 15 October 2026: one theme, 67.9 points apart
+8.1%
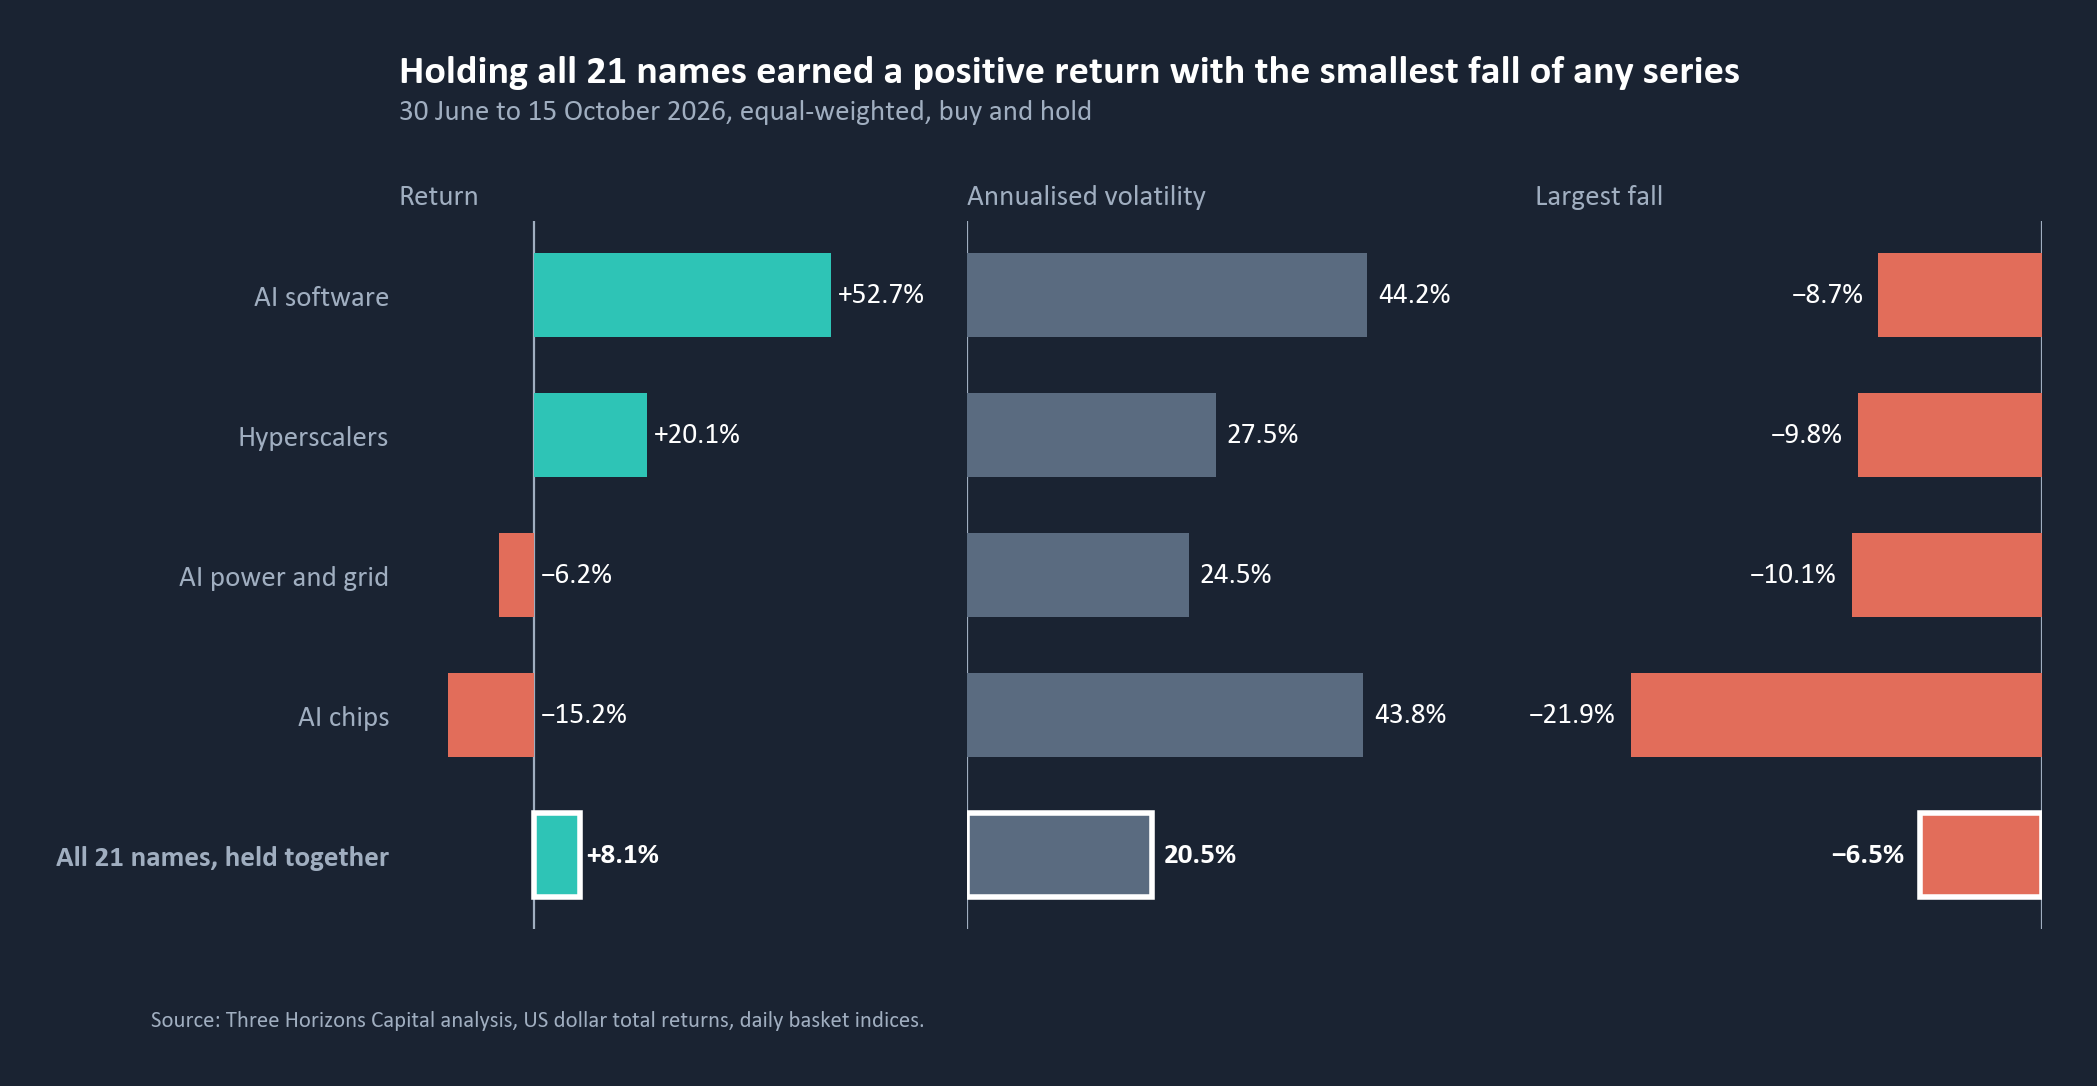
Return from holding all 21 names together, with a largest fall of 6.5% and half the volatility of the chip and software legs
2x
Pace at which three hyperscalers' bond spreads widened against the broad US investment-grade index; one issuer widened more than eleven times as fast
The finding in one line
The AI trade did not end in the third quarter, it rotated: the investor who held the whole universe earned a smoother positive return than anyone betting on one leg, while the bond market began to price the hyperscalers as a sector risk of its own.
The AI trade did not fade; it split four ways
We tracked AI exposure as four equal-weighted baskets, 21 US-listed names in all: AI chips, AI software, the hyperscalers, and AI power and grid. From the same starting level on 30 June, software finished 52.7% higher and chips 15.2% lower. Chips sold off sharply in July; power and grid derated all quarter; software rallied in every sub-period.
Software led on return; the hyperscalers led on steadiness
Software returned 52.7%, more than two and a half times the hyperscalers' 20.1%. The hyperscalers delivered the steadier path, at 27.5% annualised volatility against software's 44.2%. Which leg "led" depends on whether your clients judge you on return or on drawdown.
Holding all four worked, because they moved on different forces
Chips and power and grid moved together (correlation +0.57). Software moved against both (−0.13 and −0.23): it was where the money went. All 21 names held in equal weight, never rotated, returned 8.1%, with half the volatility of the chip and software legs and the shallowest fall of any series, 6.5%.
Bond investors repriced the hyperscalers at twice the market's pace
| Series | Spread change, 30 June to mid October |
|---|---|
| Broad US investment-grade index | +8bp |
| Three hyperscalers, average | +15.6bp |
| One hyperscale issuer | +93.0bp |
Three hyperscalers widened 13 to 20bp each while their shares rose. One issuer widened 93bp, from 139.5bp to 232.5bp, more than eleven times the index. Equity and credit told two different stories about the same companies. The growth backdrop does not explain it: our own nowcast puts first-half 2026 US real GDP growth at about 2.65%, above trend. Read the full paper
So what for allocators
Stop asking whether the AI trade is over. Ask which part of it your portfolio owns, hold it as a sleeve rather than a single bet, and read the bonds alongside the shares.
Method: equal-weighted daily baskets, US dollar total returns, 30 June to 15 October 2026, buy and hold, no costs; option-adjusted spreads on 3 to 10 year US dollar bonds against the broad US investment-grade index; growth from Three Horizons Capital's own nowcast at each quarter's close. Comparisons are basket to basket. A record of one quarter, not a forecast. Prepared by Three Horizons Capital. Not investment advice.
If this is useful
We build this kind of look-through, across equity segments, credit and macro, for portfolio teams who need to know which part of a theme they own. If that is the question in front of you, it is the work we do.